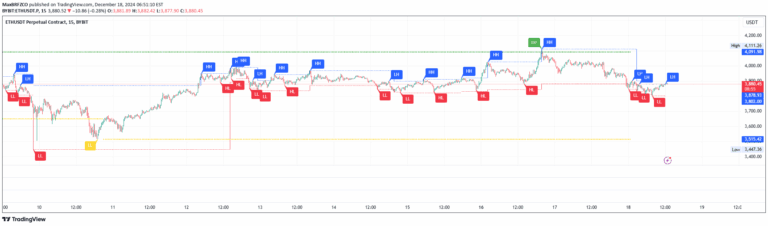
Fund Master Plus is an oscillating technical analysis tool that simulates fund inflow and outflow trends, providing insights into market momentum through candle and EMA-based signals.
Explore complementary indicator rolesHow it works
Fund Master Plus generates a dynamic oscillator that tracks fund movement through multiple analytical components. It creates a candle representing trend direction based on fund value, with green indicating upward and red indicating downward momentum.
The indicator incorporates exponential moving averages (EMA) to smooth out value fluctuations and provide trend confirmation. By analyzing crossovers with zero line and EMA lines, traders can identify potential short-term and mid-term trend changes. The tool also includes deviation lines to highlight potential buying and selling opportunities
Why it may be useful
Fund Master Plus offers traders a comprehensive view of market sentiment by simulating fund inflow and outflow dynamics. Its multi-layered approach allows investors to understand trend strength and potential reversals through visual and mathematical indicators.
The combination of candle colors, EMA lines, and deviation markers provides a nuanced perspective on market momentum. Traders can use these signals to make more informed decisions about entry and exit points, reducing emotional trading and increasing strategic precision
When to explore it
Fund Master Plus is most effective in markets with clear trending characteristics, particularly during swing trading and day trading scenarios. It performs best in liquid markets with consistent volume and directional movement.
Traders should use this indicator alongside other technical analysis tools to confirm signals and reduce false positives. It is particularly useful during periods of market transition, helping identify potential trend reversals and momentum shifts. The indicator is most reliable when combined with proper risk management strategies
Keep exploring
What we’ve verified
Access, alerts and repainting behaviour have not been independently verified for this indicator. Check the creator’s current publication and settings.
General descriptions and classifications are recovered research. Verified details above identify the specific checks we have completed. Check the creator’s current publication for later changes.