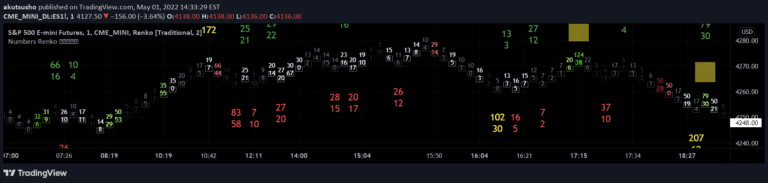
Renko Candles Overlay
Renko Candles Overlay is a charting technique that transforms price action into uniform-sized bricks, offering a simplified visual representation of market trends and price movements.
Explore 11,183 indicators. Filter beyond the obvious.
Discover the tools that fit the way you trade.
11,183 tools to explore
Renko Candles Overlay is a charting technique that transforms price action into uniform-sized bricks, offering a simplified visual representation of market trends and price movements.
Advanced intrabar analysis tool offering multiple price representation modes, volume insights, and technical indicators to provide comprehensive market visualization and trading insights.
A Renko RSI tool that calculates momentum using custom Renko chart methodology, filtering price noise and focusing on significant price movements across different timeframes.
A Renko chart indicator that displays volume and time metrics within chart boxes, utilizing Wyckoff method principles to provide visual trading insights through color-coded numerical representations.
A Renko chart-based trading indicator that generates buy and sell signals by tracking price movements through customizable brick formations, helping traders identify trend changes.
A Renko Indicator that generates buy and sell signals by creating brick charts based on price movements, helping traders identify market trends and potential trading opportunities.
Renko chart overlay provides a simplified view of market direction by creating price boxes that clearly show trend movement and key market points across different timeframes.
A Renko chart strategy integrating Fibonacci retracement levels to analyze price trends and volatility with adaptive box sizing and color-coded trend visualization.
A Renko-based chart emulator that plots price boxes using traditional or ATR methods, with optional EMA line for trend indication and non-repainting capabilities.
A Renko-based Ichimoku Cloud indicator that smooths price movements and provides trend signals using standard Ichimoku components with enhanced visualization.
A dynamic Renko calculation method that adapts brick size based on price volatility, providing a flexible approach to identifying market trends and potential price movements.
A customizable moving average ribbon that uses multiple sources and MA types to help traders identify trends and price movements with enhanced flexibility.
Likes, views, and comments are historical TradingView snapshots. They describe attention, not trading performance.