Volatility Compression Breakout
A volatility compression breakout indicator that identifies low volatility periods and potential market breakouts using Keltner Channels and EMA to signal trend direction and momentum.
Explore 11,183 indicators. Filter beyond the obvious.
Discover the tools that fit the way you trade.
11,183 tools to explore
A volatility compression breakout indicator that identifies low volatility periods and potential market breakouts using Keltner Channels and EMA to signal trend direction and momentum.
A dynamic Bull Bear Power indicator that measures market sentiment through price differential and exponential moving averages, with optional normalization for enhanced trading insights.
A momentum indicator that analyzes price velocity and acceleration using mathematical calculations, providing insights into market momentum through color-coded visual representations.
The Adaptive Gaussian Moving Average is a dynamic trend indicator that adjusts its smoothing based on market volatility, providing a responsive analysis of price movements.
On-Balance Accumulation Distribution (OBAD) is a volume-weighted indicator that analyzes buying and selling pressure to help traders identify market trends and potential reversals.
A multi-tool trading signal combining RSI, RSI moving average, and Fisher Transform to identify potential buy and sell opportunities with varying signal strengths.
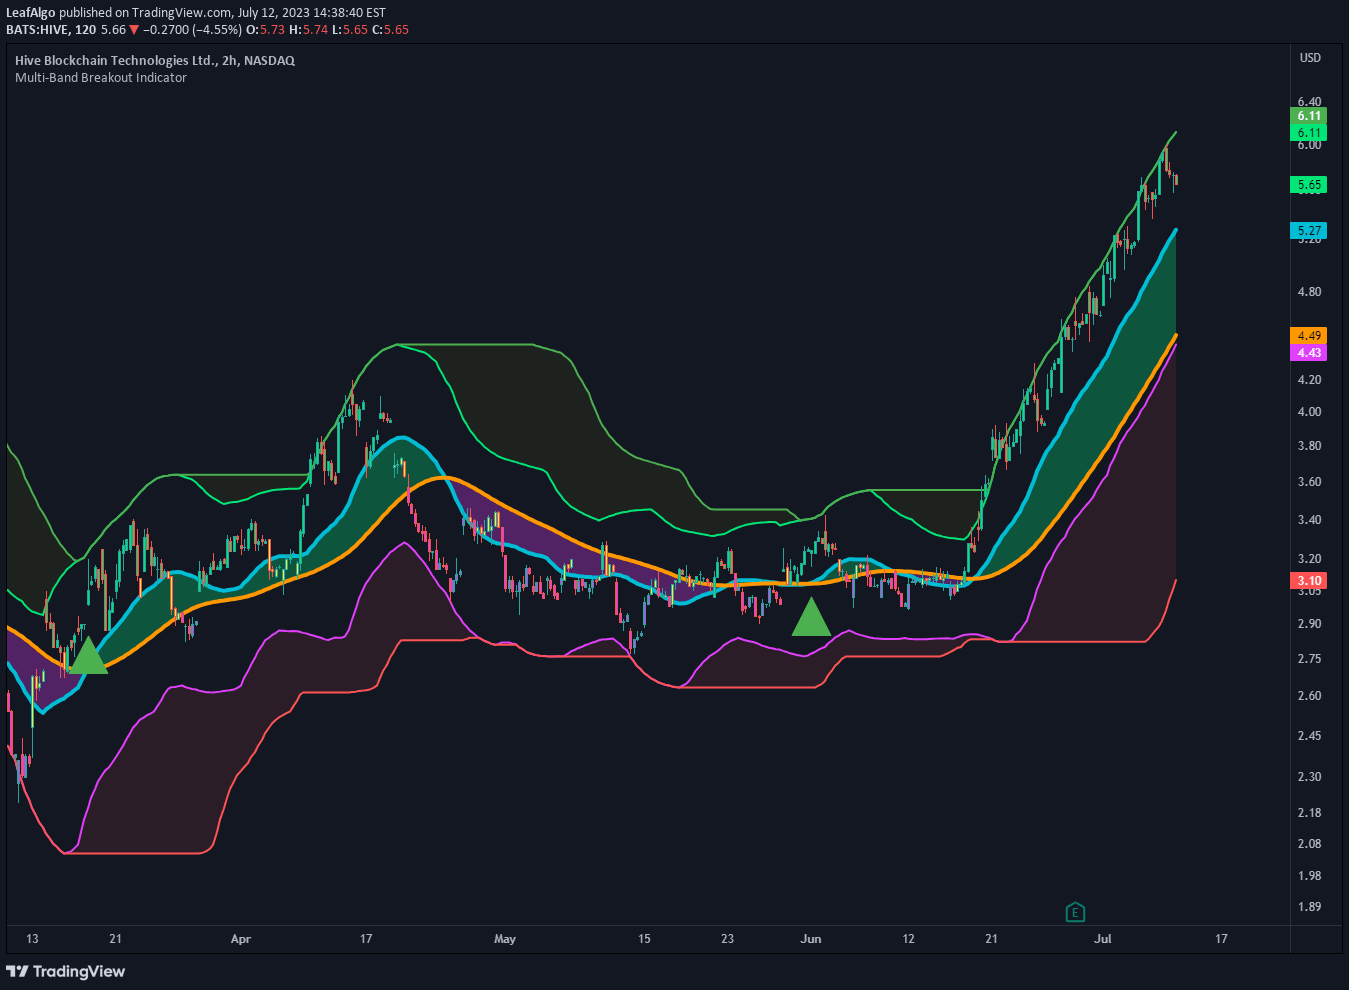
A multi-band breakout indicator that combines ATR and Donchian bands with moving averages to identify potential trend shifts and breakout opportunities in market price movements.
The Moving Average Contrarian Indicator identifies potential market turning points by measuring price distance from a moving average and normalizing the values between 0 and 100.
A volatility-based indicator that identifies mean reversion opportunities by creating dynamic bands around price using average true range and tracking potential reversal zones.
Volume Delta Candles visualize the difference between buying and selling volumes, creating custom candlesticks that indicate market sentiment through color-coded volume pressure.
An adaptive trading indicator identifying mean reversion opportunities by dynamically adjusting parameters based on market volatility, using standard deviation and RSI confluence.
The Filtered Momentum Indicator combines momentum and Bollinger Bands to analyze price trend changes and provide insights into potential market momentum shifts.
Likes, views, and comments are historical TradingView snapshots. They describe attention, not trading performance.