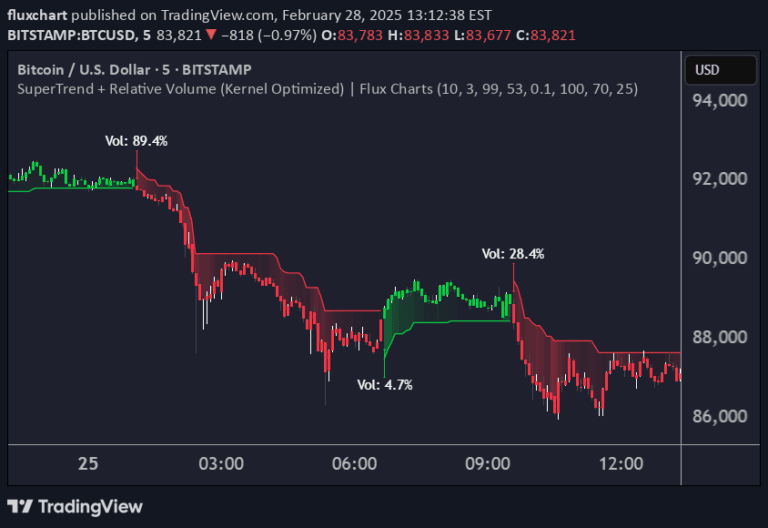
A multi-band breakout indicator that combines ATR and Donchian bands with moving averages to identify potential trend shifts and breakout opportunities in market price movements.
Explore complementary indicator rolesHow it works
The Multi-Band Breakout Indicator calculates dynamic upper and lower bands using Average True Range (ATR) and a specified multiplier. It creates a central trend line by averaging these bands and introduces a trend moving average to smooth out price movements and identify potential trend directions.
The indicator generates signals by analyzing the relationship between the trend line, trend moving average, and price action. It looks for crossovers between the trend line and trend moving average, combined with price breaking through upper or lower bands, to detect potential bullish or bearish breakout opportunities.
Why it may be useful
The Multi-Band Breakout Indicator provides traders with a comprehensive view of market dynamics by integrating multiple analytical components. It helps identify potential trend changes, breakout opportunities, and market momentum shifts, enabling traders to make more informed trading decisions with greater confidence.
By combining volatility measurements, trend analysis, and breakout confirmation, the indicator offers a nuanced approach to market interpretation. Traders can use these insights to potentially enter trades at early stages of trend development and manage their risk more effectively.
When to explore it
The Multi-Band Breakout Indicator works best in trending markets with clear directional price movements. It is particularly effective during periods of sustained bullish or bearish momentum, where price shows consistent movement beyond established support and resistance levels.
Traders should apply this indicator when seeking to identify potential trend reversals, breakout opportunities, and early momentum shifts. It is most reliable when used in conjunction with other technical analysis tools and during market conditions that demonstrate strong, directional price action.
Keep exploring
What we’ve verified
Access, alerts and repainting behaviour have not been independently verified for this indicator. Check the creator’s current publication and settings.
General descriptions and classifications are recovered research. Verified details above identify the specific checks we have completed. Check the creator’s current publication for later changes.