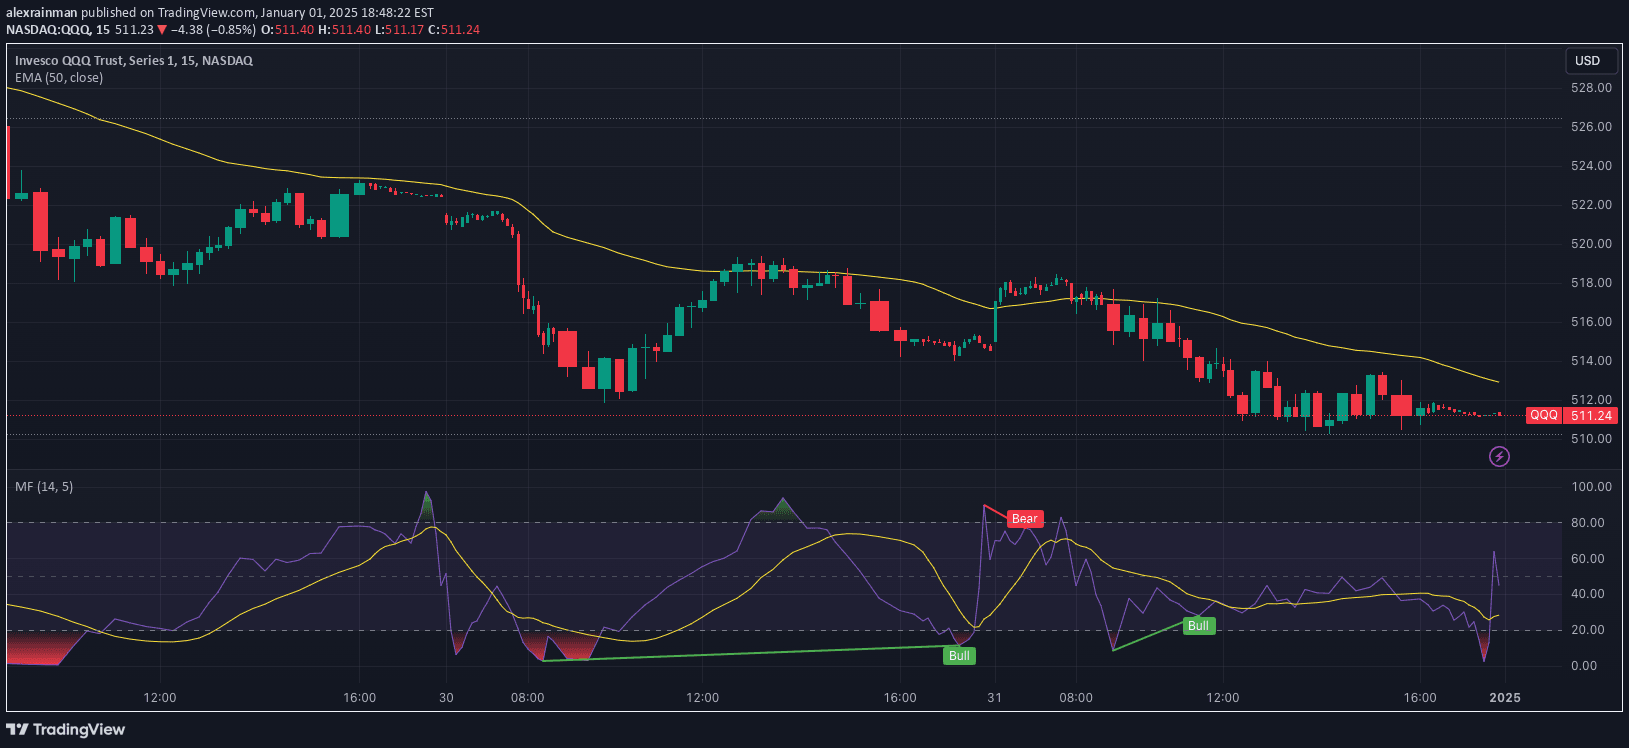
An advanced trading indicator combining Supertrend and Relative Volume using Kernel Density Estimation to predict trend breaks with probabilistic precision and volume confirmation.
Explore complementary indicator rolesHow it works
The KDE Optimized Supertrend Indicator calculates the SuperTrend line using Average True Range, tracking trend direction and potential reversals. When price crosses the SuperTrend line, the system logs the break point and analyzes its relative volume.
Using Kernel Density Estimation, the indicator applies a Gaussian kernel function to break points and volume data, creating a probability density array. This process estimates the likelihood of a significant trend break by considering historical price action and volume patterns, generating a KDE percentage that reflects the potential trend reversal's reliability.
Why it may be useful
By combining trend analysis, volume confirmation, and probabilistic estimation, this indicator provides traders with a more nuanced approach to identifying potential market reversals. The KDE percentage offers insights beyond traditional trend indicators, helping traders distinguish between random price fluctuations and meaningful trend shifts.
The innovative approach allows traders to assess the statistical significance of potential trend breaks, reducing false signals and improving trade entry precision. By incorporating relative volume and kernel density estimation, the indicator offers a sophisticated method for evaluating market momentum and potential trend changes.
When to explore it
The KDE Optimized Supertrend Indicator is most effective in markets with clear trend characteristics and moderate to high trading volume. It performs exceptionally well in liquid markets like major forex pairs, large-cap stocks, and prominent cryptocurrency pairs where volume data provides meaningful insights.
Traders should prioritize this indicator during periods of established market trends, using it to confirm potential reversals and assess the probability of trend continuation or change. It is particularly useful in volatile market conditions where traditional trend indicators might generate ambiguous or lagging signals.
Keep exploring
What we’ve verified
Access, alerts and repainting behaviour have not been independently verified for this indicator. Check the creator’s current publication and settings.
General descriptions and classifications are recovered research. Verified details above identify the specific checks we have completed. Check the creator’s current publication for later changes.