RSI (Kernel Optimized) | Flux Charts
A specialized RSI indicator using Kernel Density Estimation to predict potential pivot points by analyzing historical RSI patterns and calculating probability of price reversals.
Explore 11,183 indicators. Filter beyond the obvious.
Discover the tools that fit the way you trade.
11,183 tools to explore
A specialized RSI indicator using Kernel Density Estimation to predict potential pivot points by analyzing historical RSI patterns and calculating probability of price reversals.
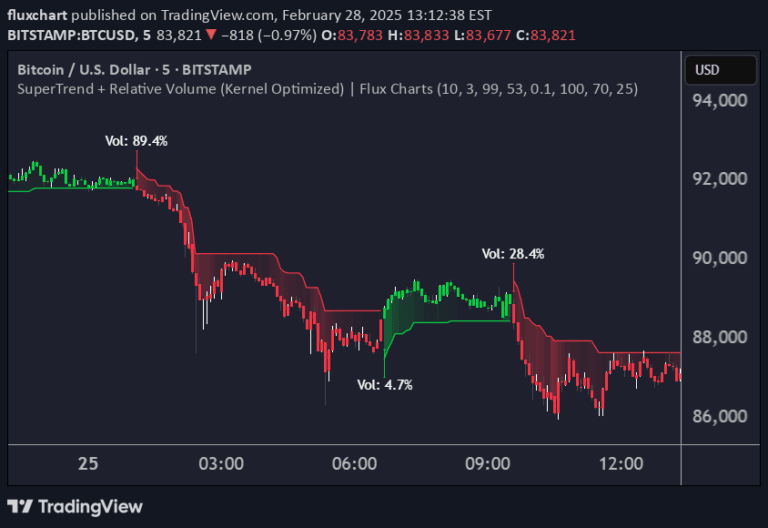
An advanced trading indicator combining Supertrend and Relative Volume using Kernel Density Estimation to predict trend breaks with probabilistic precision and volume confirmation.
A tick-based indicator that calculates Cumulative Volume Delta (CVD) using live price ticks, offering real-time insights into buying and selling volume dynamics.
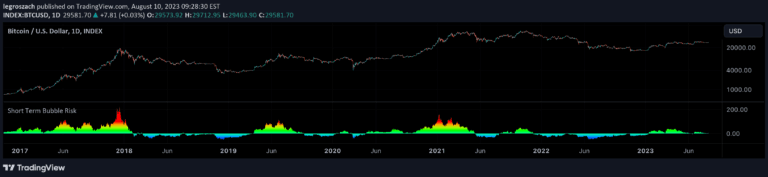
A weekly risk indicator for Bitcoin and Ethereum that measures price extension from the 20-week simple moving average, providing a color-coded risk oscillator to assess short-term market conditions.
An indicator measuring a symbol's current price relative to its all-time high, providing insights into potential future gains and market performance.
True Envelopes is an advanced price envelope indicator that dynamically tracks price movements using high-pass filtering and kernel density estimation to identify precise support and resistance levels.
A technical indicator that automatically plots previous day's high and low levels on a chart, helping traders identify key support and resistance zones for strategic entry and exit points.
Likes, views, and comments are historical TradingView snapshots. They describe attention, not trading performance.