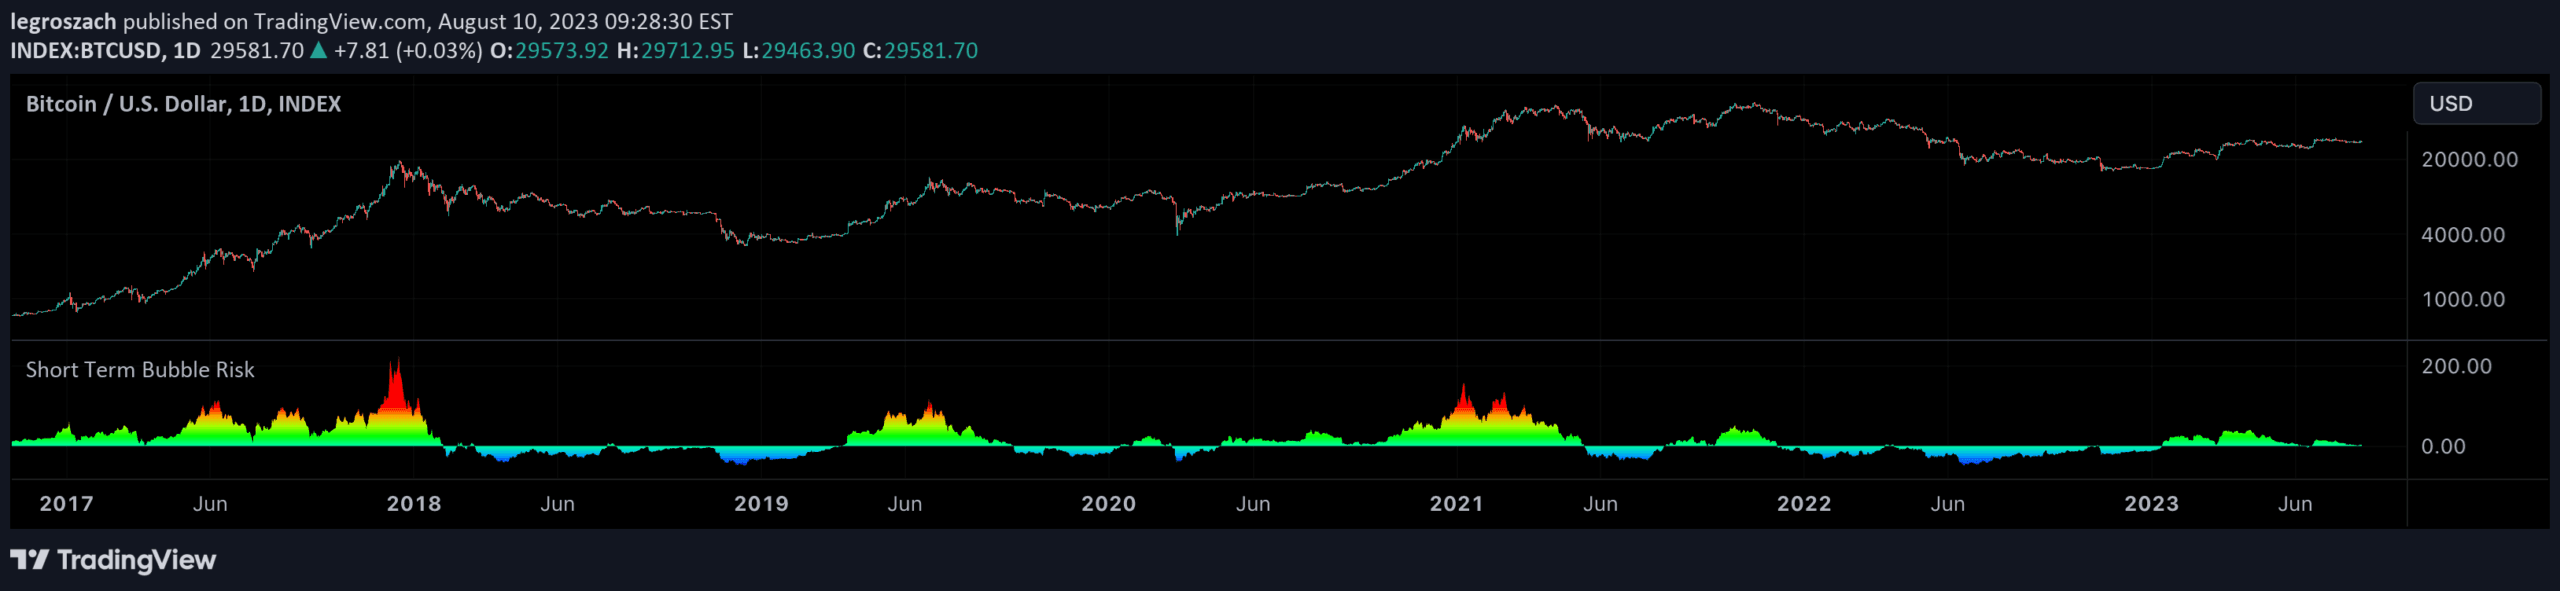
A weekly risk indicator for Bitcoin and Ethereum that measures price extension from the 20-week simple moving average, providing a color-coded risk oscillator to assess short-term market conditions.
Explore complementary indicator rolesHow it works
The indicator calculates the distance between the current closing price and the 20-week simple moving average (SMA) to determine short-term market risk. It creates a color-coded oscillator that visually represents how far the price has deviated from its long-term average trend.
As the price moves further from the 20-week SMA, the oscillator changes color and intensity, signaling increasing risk levels. When the price is close to the SMA, the risk is considered lower, while significant extensions suggest higher potential for a market correction or trend reversal.
Why it may be useful
This risk indicator provides traders with a quick visual assessment of potential market volatility and short-term price dynamics. By highlighting when prices are significantly extended from their average trend, it helps traders identify potential overbought or oversold conditions in the market.
The color-coded display makes it easy to quickly interpret market risk, allowing traders to make more informed decisions about entry, exit, and risk management strategies. It is particularly useful for understanding short-term market sentiment in cryptocurrencies like Bitcoin and Ethereum.
When to explore it
The indicator is most effective when used on weekly timeframes for cryptocurrencies, particularly Bitcoin and Ethereum. Traders can use it to assess short-term market risk and potential trend reversals during periods of significant price movement.
It works best when combined with other technical analysis tools and fundamental research. Traders should pay special attention to extreme color changes that might indicate heightened market risk or potential trend shifts, using the oscillator as a complementary tool in their overall trading strategy.
Keep exploring
What we’ve verified
Access, alerts and repainting behaviour have not been independently verified for this indicator. Check the creator’s current publication and settings.
General descriptions and classifications are recovered research. Verified details above identify the specific checks we have completed. Check the creator’s current publication for later changes.