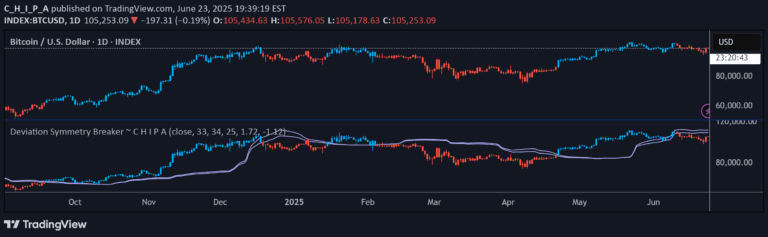
COV Bands is a custom volatility indicator that uses the Coefficient of Variation to identify price movement dynamics and potential trend shifts through adaptive bands and candle coloring.
Explore complementary indicator rolesHow it works
The COV Bands indicator calculates volatility using the Coefficient of Variation, which measures price deviation relative to a Simple Moving Average (SMA) baseline. It dynamically generates upper and lower bands by applying configurable multipliers to the standard deviation of price movements, creating adaptive volatility boundaries.
As price moves beyond these bands, the indicator provides visual feedback through candle coloring, using electric blue for bullish momentum and bright red for bearish momentum. Users can adjust the standard deviation length to manage signal sensitivity and smoothness, allowing for customized volatility tracking across different market conditions.
Why it may be useful
The COV Bands indicator offers traders a sophisticated method for understanding market volatility and potential trend changes by providing a dynamic, visual representation of price movement characteristics. By quantifying price deviation from a mean baseline, traders can gain insights into market behavior that might not be immediately apparent through traditional price analysis.
The adaptive nature of the bands and the intuitive color-coding system enables traders to quickly identify significant price movements, potential breakouts, and possible trend reversals. This makes the indicator a valuable tool for assessing market momentum and making more informed trading decisions across various timeframes.
When to explore it
COV Bands is most effective in markets with clear trending or volatile characteristics, where price movements exhibit significant deviations from average levels. Traders can utilize this indicator during periods of potential market transitions, such as when price approaches critical support or resistance levels or shows signs of potential breakout or reversal.
The indicator is particularly useful for short-term trading strategies like scalping and day trading, where rapid identification of momentum shifts can provide a competitive edge. However, traders should combine COV Bands with other technical analysis tools and be aware that the indicator has not undergone formal robustness testing, which means its predictive power is not guaranteed in all market conditions.
Keep exploring
What we’ve verified
Access, alerts and repainting behaviour have not been independently verified for this indicator. Check the creator’s current publication and settings.
General descriptions and classifications are recovered research. Verified details above identify the specific checks we have completed. Check the creator’s current publication for later changes.