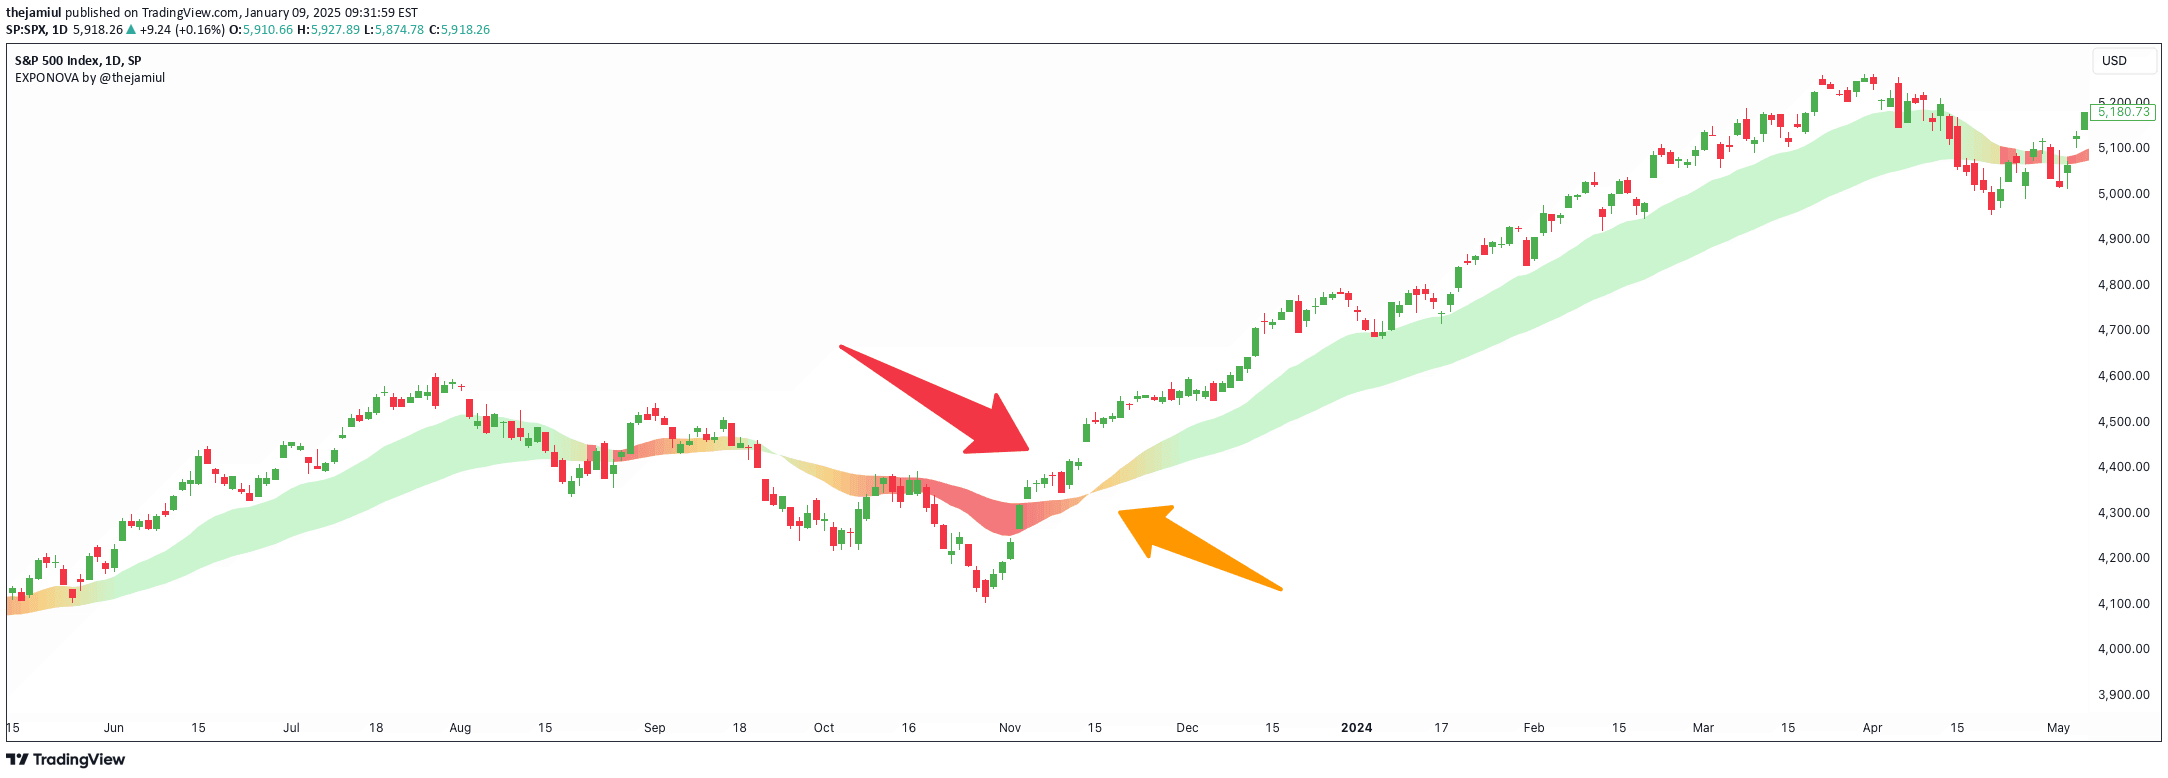
A custom indicator using Bollinger Bands and EMAs to analyze market trends, generate entry signals, and track momentum through dynamic price band and moving average interactions.
Explore complementary indicator rolesHow it works
The indicator calculates Bollinger Bands using a 20-period Simple Moving Average with a standard deviation multiplier of 2, creating upper and lower price bands. Simultaneously, it computes three Exponential Moving Averages (EMAs) of 5, 10, and 40 periods on the closing price, plotting them in different colors to visualize price momentum.
The script then evaluates trend direction by analyzing the relative positions of these EMAs, determining bullish or bearish market states. Entry signals are generated when the close price crosses specific Bollinger Band thresholds, complemented by EMA alignment and momentum conditions that confirm potential trend reversals.
Why it may be useful
This indicator provides traders with a comprehensive view of market dynamics by combining multiple analytical techniques into a single, intuitive visualization. By integrating Bollinger Bands' volatility measurements with EMA trend analysis, traders can more accurately identify potential entry and exit points across different market conditions.
The visual representation of trend states through bar colors and signal shapes helps traders quickly understand market momentum, reducing the complexity of interpreting multiple technical indicators simultaneously and enabling more informed trading decisions.
When to explore it
The indicator is most effective in markets with clear trending characteristics, such as forex, stocks, and cryptocurrencies that exhibit consistent directional movements. It performs optimally in timeframes ranging from 5-minute to daily charts, where short-term momentum and volatility patterns are more pronounced and actionable.
Traders should apply this signal during periods of moderate to high market volatility, avoiding extremely choppy or range-bound markets where signal reliability might be compromised. It is particularly useful for traders seeking a dynamic, multi-dimensional approach to trend identification and entry signal generation.
Keep exploring
What we’ve verified
Access, alerts and repainting behaviour have not been independently verified for this indicator. Check the creator’s current publication and settings.
General descriptions and classifications are recovered research. Verified details above identify the specific checks we have completed. Check the creator’s current publication for later changes.