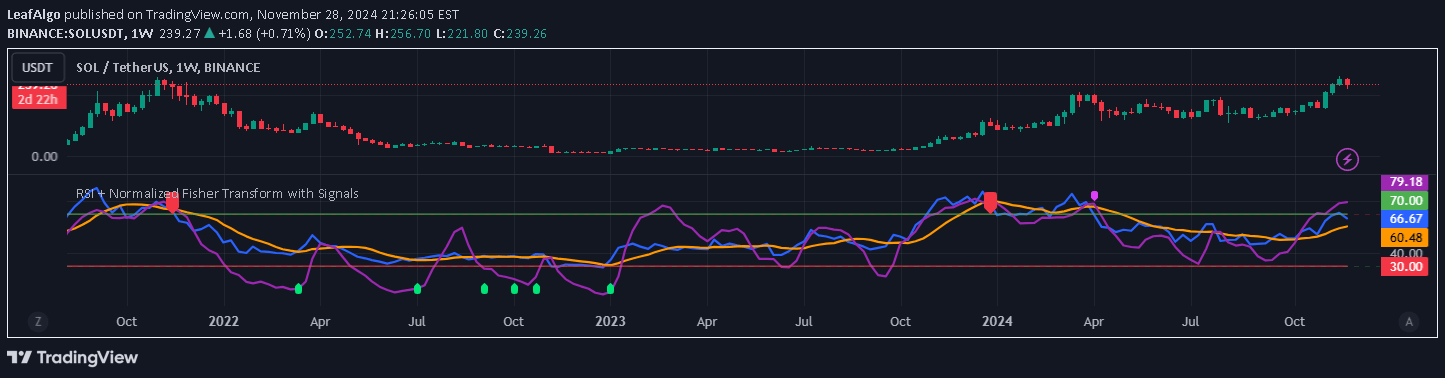
A multi-tool trading signal combining RSI, RSI moving average, and Fisher Transform to identify potential buy and sell opportunities with varying signal strengths.
Explore complementary indicator rolesHow it works
The indicator integrates three analytical tools to generate trading signals: the Relative Strength Index (RSI), its moving average, and the Fisher Transform. It calculates the RSI to measure price momentum, creates a smoothed moving average of the RSI to filter noise, and applies the Fisher Transform to normalize price data into a Gaussian distribution.
By analyzing these three components together, the indicator generates four types of signals: strong buy, weak buy, strong sell, and weak sell. These signals are determined by specific conditions involving the RSI's position relative to its moving average, the RSI's position within predefined oversold and overbought thresholds, and the Fisher Transform's directional changes.
Why it may be useful
This indicator provides traders with a comprehensive market analysis tool that goes beyond single-metric evaluations. By combining momentum, trend confirmation, and potential reversal signals, it offers a more nuanced approach to identifying trading opportunities across different market conditions.
The multi-layered signal generation helps traders distinguish between high-probability and lower-confidence trade setups, reducing the likelihood of false signals. Its flexibility in customizing thresholds and lengths allows traders to adapt the indicator to different assets and trading styles, making it a versatile tool for various market environments.
When to explore it
The indicator performs best in trending markets where momentum and potential reversals are more clearly defined. It is particularly effective when assets are moving strongly in either an upward or downward direction, allowing traders to identify potential entry and exit points with greater accuracy.
Traders should exercise caution when using this indicator in sideways or highly volatile markets, where momentum signals may be less reliable. It is recommended to combine this tool with other technical analysis methods, such as trendlines, support and resistance levels, and volume indicators, to confirm signals and improve overall trading strategy.
Keep exploring
What we’ve verified
Access, alerts and repainting behaviour have not been independently verified for this indicator. Check the creator’s current publication and settings.
General descriptions and classifications are recovered research. Verified details above identify the specific checks we have completed. Check the creator’s current publication for later changes.