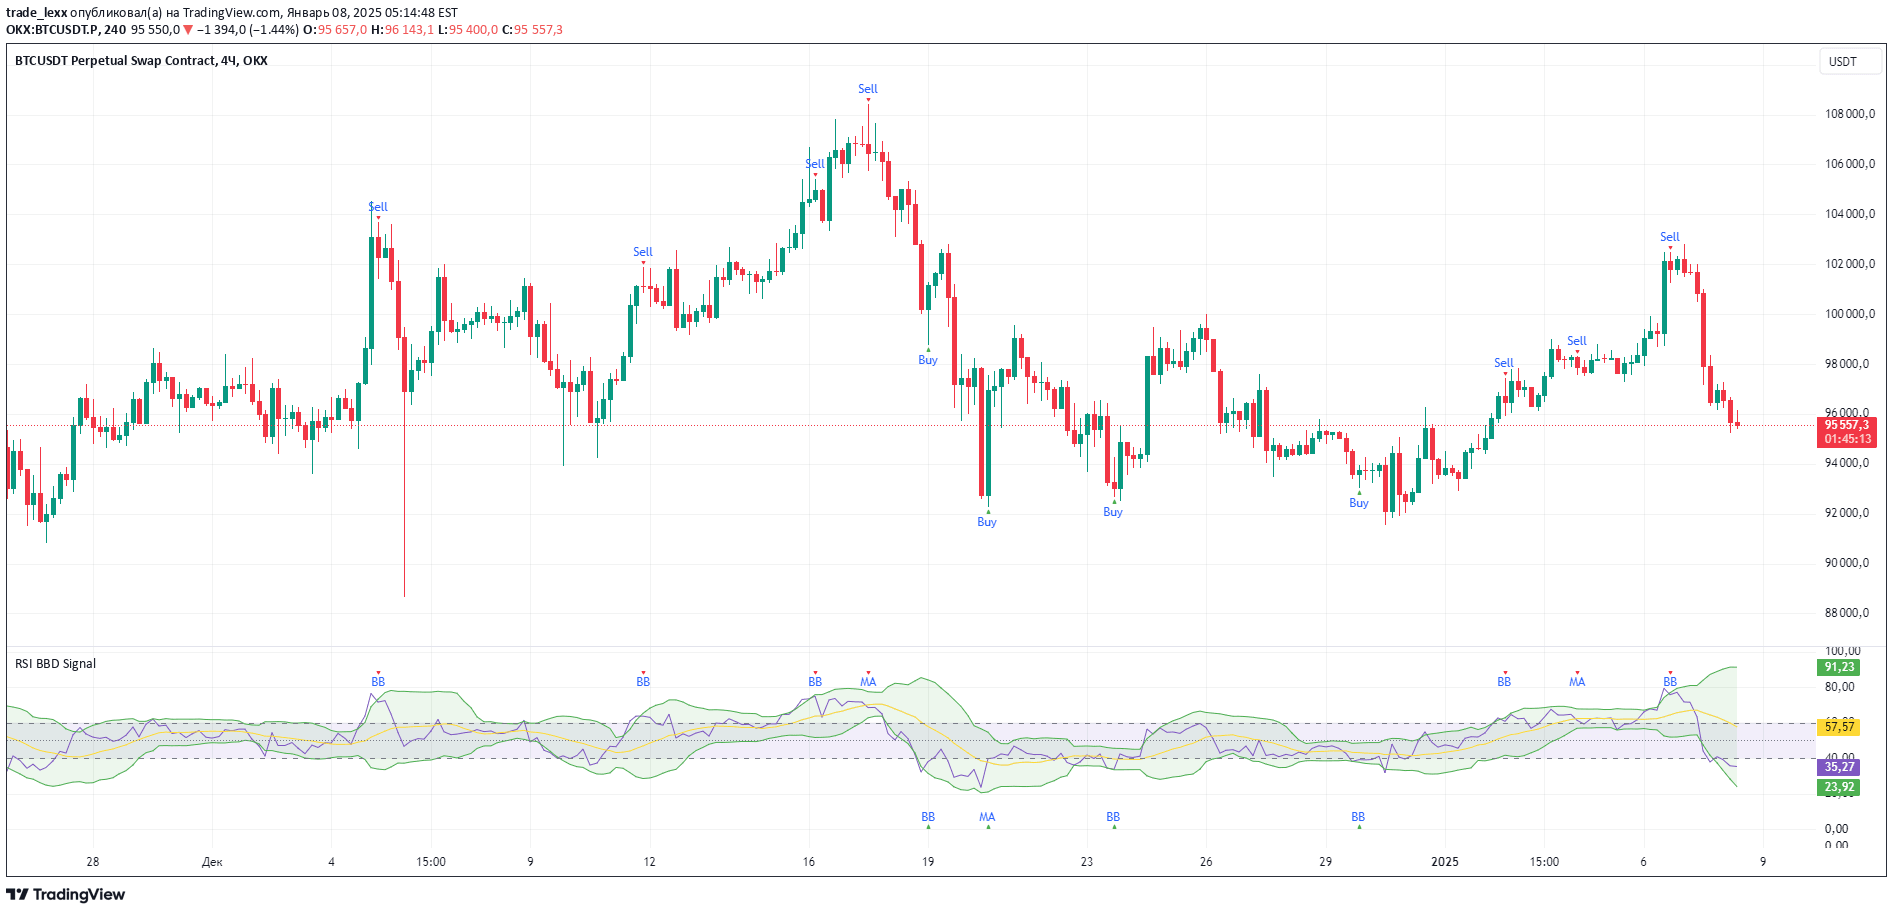
A multi-timeframe RSI indicator that combines RSI with its SMA to generate buy and sell signals, filtering trades using overbought and oversold conditions for more reliable entries.
Explore complementary indicator rolesHow it works
The MTF RSI & SMA Crossover indicator calculates the Relative Strength Index (RSI) on a customizable timeframe, providing a view of price momentum beyond the current chart period. It then applies a Simple Moving Average (SMA) to the RSI, which helps smooth out price fluctuations and reduce market noise.
The indicator generates signals based on specific crossover conditions, with buy signals triggered when the RSI crosses above its SMA after being in an oversold state (below 30). Conversely, sell signals occur when the RSI crosses below its SMA after being in an overbought state (above 70), indicating potential trend reversals.
Why it may be useful
This indicator is crucial for traders seeking to identify high-probability trend reversal points with enhanced precision and reliability. By incorporating multi-timeframe analysis and using the RSI's overbought and oversold conditions, traders can filter out many false signals that typically plague momentum-based strategies.
The combination of RSI and its SMA provides a more nuanced view of market momentum, allowing traders to make more informed decisions about potential entry and exit points. This approach helps traders avoid impulsive trades and focus on moments when the market shows genuine signs of momentum shift.
When to explore it
The MTF RSI & SMA Crossover is most effective in markets with clear trending characteristics, where momentum changes can signal significant price movements. It works particularly well in liquid markets with consistent price action, such as major forex pairs, stock indices, and high-volume commodities.
Traders should utilize this indicator during periods of moderate to high market volatility, where momentum shifts are more likely to produce meaningful trading opportunities. It is especially valuable when combined with other technical analysis tools to confirm signals and provide additional context for trading decisions.
Keep exploring
What we’ve verified
Access, alerts and repainting behaviour have not been independently verified for this indicator. Check the creator’s current publication and settings.
General descriptions and classifications are recovered research. Verified details above identify the specific checks we have completed. Check the creator’s current publication for later changes.