
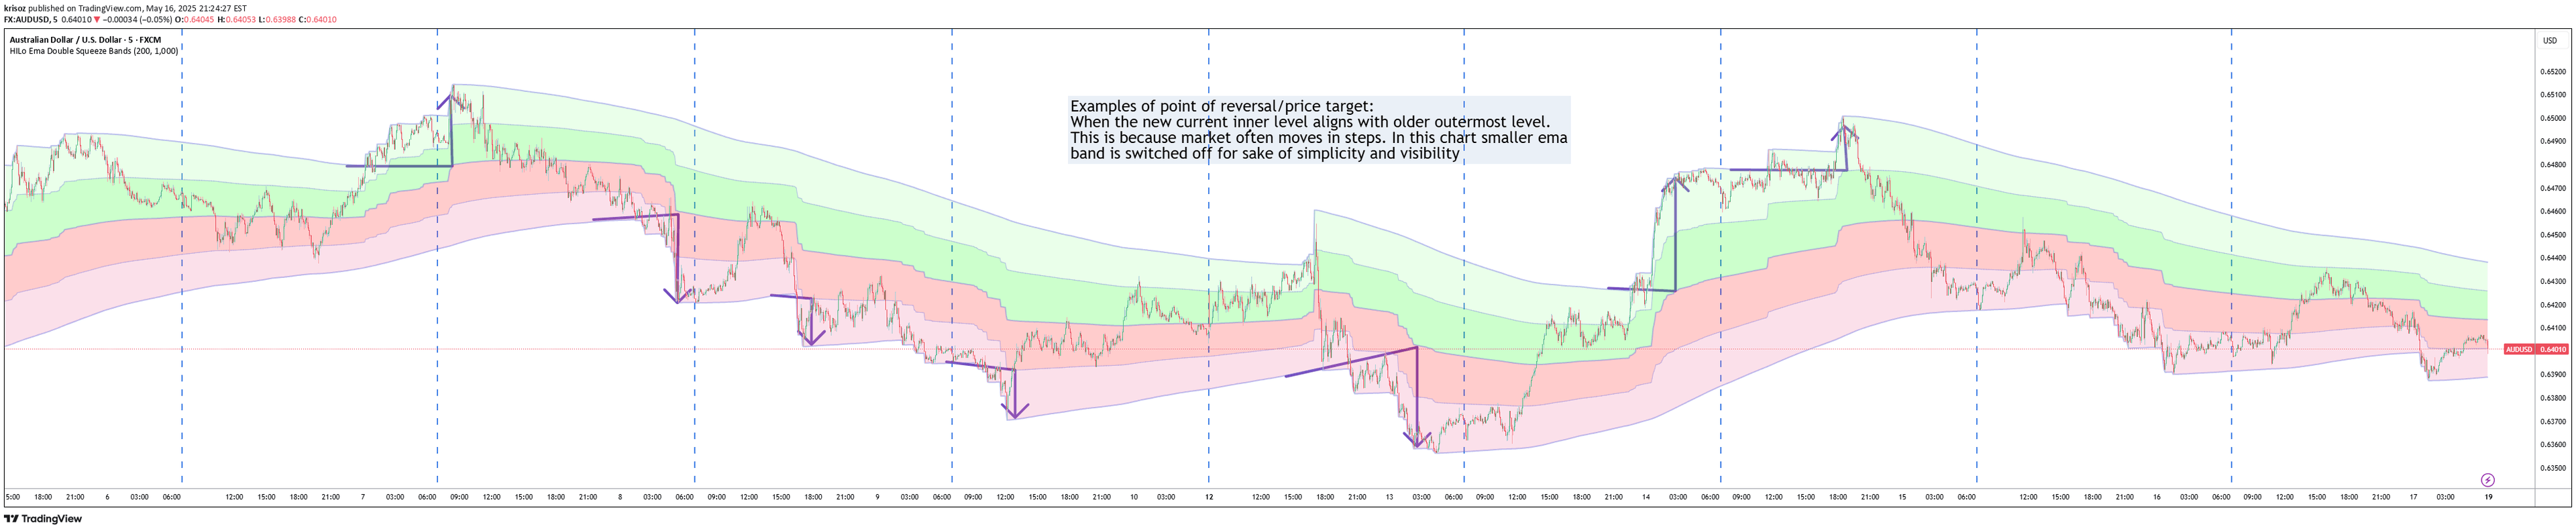
A dynamic EMA-based indicator that creates adaptive price channels with quartile divisions to identify potential market moves and provide precise entry and exit points.
Explore complementary indicator rolesHow it works
The HILo Ema Double Squeeze Bands indicator creates adaptive price channels by tracking price highs and lows using both short-term and long-term exponential moving averages (EMAs). It divides the price range into five key levels: Upper2, Upper1, Middle, Lower1, and Lower2, which helps traders identify market dynamics and potential trend shifts.
The indicator initializes EMAs at each new high or low, with the upper EMA tracking highs and the lower EMA tracking lows. This creates a more responsive alternative to traditional Donchian channels, offering traders a sophisticated view of price movement and potential reversal points across different market conditions.
Why it may be useful
This indicator provides traders with a comprehensive view of market dynamics by creating adaptive price channels that respond to changing market conditions. Its quartile divisions and dual EMA band system allow for more precise identification of potential entry and exit points, helping traders make more informed decisions about market trends and potential reversals.
The visual color-coded zones and optional price labels make it easier for traders to quickly interpret market movements and potential trading opportunities. By combining short-term and long-term EMAs, the indicator offers a more nuanced approach to understanding price action compared to traditional technical analysis tools.
When to explore it
The HILo Ema Double Squeeze Bands is most effective on longer timeframes, particularly H4, Daily, and Weekly charts, making it ideal for swing traders and position traders. It works best in markets with clear trending characteristics, where price movements can be more predictably analyzed using adaptive channels.
Traders should pay special attention to price breaks above the Upper2 or below the Lower2 levels, as these can signal potential reversal points. The indicator is particularly useful when combined with other technical analysis tools and when looking to identify potential trend changes or continuation patterns in the market.
Keep exploring
What we’ve verified
Access, alerts and repainting behaviour have not been independently verified for this indicator. Check the creator’s current publication and settings.
General descriptions and classifications are recovered research. Verified details above identify the specific checks we have completed. Check the creator’s current publication for later changes.


