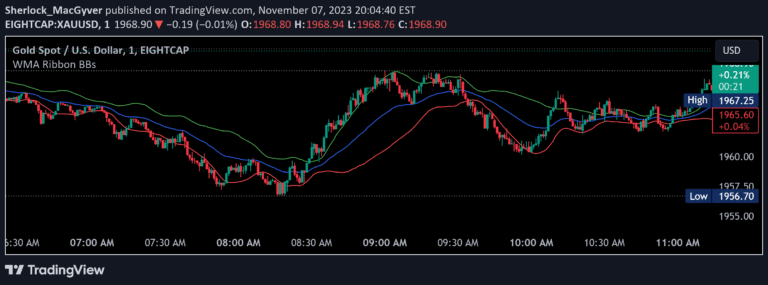
A technical indicator using moving averages and standard deviations to identify market trends, potential entry/exit points, and trading opportunities across different timeframes.
Explore complementary indicator rolesHow it works
The Rekt Edge Reversion band calculates price movements relative to a chosen moving average (SMA or EMA) and establishes channels based on standard deviation multiples. By plotting these channels, traders can visualize potential price boundaries and assess market conditions.
The indicator dynamically adjusts its parameters, allowing users to customize the moving average period, separation unit, and deviation multiples. This flexibility enables traders to adapt the indicator to different market conditions, timeframes, and trading styles, providing a comprehensive view of potential trend reversals and breakout opportunities.
Why it may be useful
The Rekt Edge Reversion band provides traders with a sophisticated tool for understanding market dynamics and identifying potential trading opportunities. By integrating moving averages and standard deviation channels, the indicator offers insights into price momentum, trend strength, and potential reversal points.
Its adaptability and comprehensive approach make it valuable for traders seeking to make informed decisions. The indicator helps traders recognize overbought or oversold conditions, confirm trend directions, and develop more strategic entry and exit strategies across various financial markets.
When to explore it
The Rekt Edge Reversion band is most effective in markets with clear trending or ranging characteristics. Traders can leverage this indicator when seeking to identify potential trend reversals, breakouts, or periods of price consolidation. It works particularly well in markets with consistent price movements and identifiable patterns.
The indicator is especially useful when combined with other technical analysis tools, providing additional confirmation of trading signals. Traders can apply it across different asset classes and timeframes, making it a versatile tool for comprehensive market analysis and decision-making.
Keep exploring
What we’ve verified
Access, alerts and repainting behaviour have not been independently verified for this indicator. Check the creator’s current publication and settings.
General descriptions and classifications are recovered research. Verified details above identify the specific checks we have completed. Check the creator’s current publication for later changes.