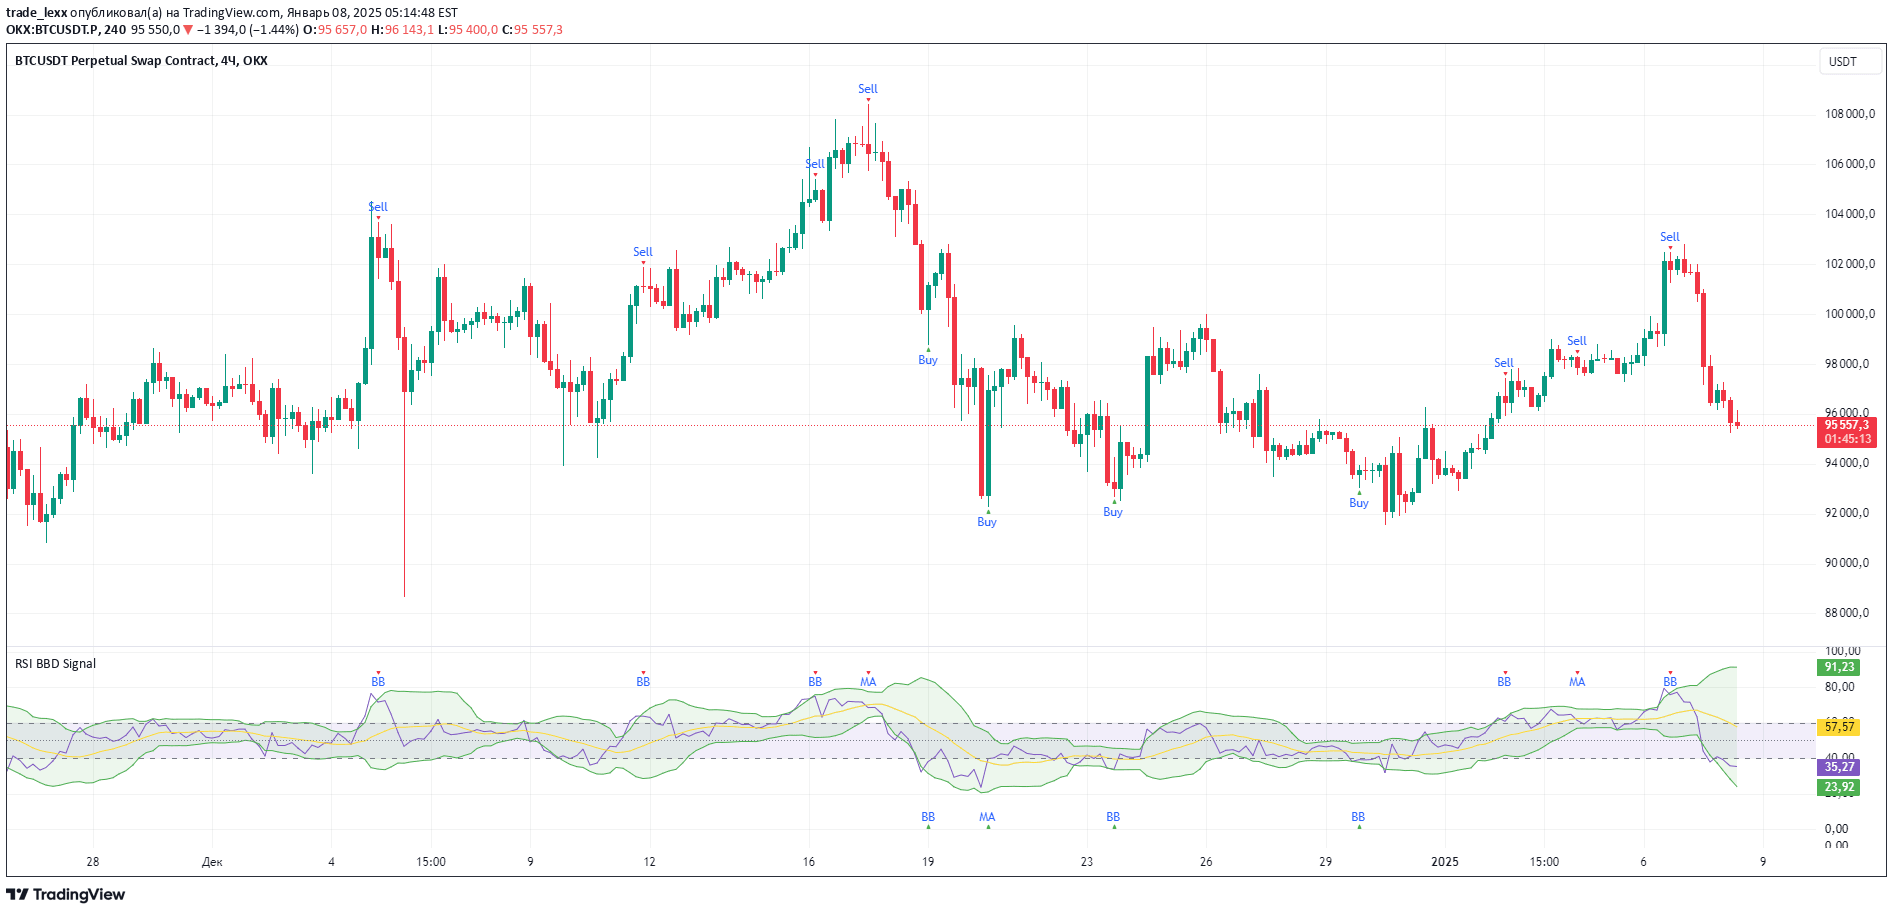
A multi-indicator trading signal combining Stochastic RSI, RSI, and MACD to generate buy and sell signals with color-coded strength indicators.
Explore complementary indicator rolesHow it works
The indicator calculates Stochastic RSI, RSI, and MACD values to generate trading signals with different strength levels. It evaluates market conditions by analyzing momentum indicators across multiple timeframes and computational methods.
By combining these technical indicators, the signal identifies potential entry and exit points through a complex algorithmic approach. The system uses color-coded labels to represent signal strength, with green and blue indicating buy signals and red and orange representing sell signals.
Why it may be useful
This multi-indicator approach provides traders with a more comprehensive market analysis by integrating different momentum and trend detection methods. By using multiple technical indicators simultaneously, traders can gain deeper insights into potential price movements and market conditions.
The signal's flexibility allows customization of parameters, enabling traders to adapt the tool to their specific trading styles and risk tolerances. Its color-coded strength system helps traders quickly understand signal reliability and make more informed trading decisions.
When to explore it
The indicator works best in markets with clear momentum shifts and during periods of potential trend reversals. It is particularly effective when price is experiencing overbought or oversold conditions and shows signs of potential directional change.
Traders should use this signal in conjunction with other technical analysis tools and consider broader market trends. It is most reliable when applied across multiple timeframes and when complemented by additional confirmation from support/resistance levels and volume analysis.
Keep exploring
What we’ve verified
Access, alerts and repainting behaviour have not been independently verified for this indicator. Check the creator’s current publication and settings.
General descriptions and classifications are recovered research. Verified details above identify the specific checks we have completed. Check the creator’s current publication for later changes.