Stoch RSI and RSI Buy/Sell Signals with MACD Trend Filter
A multi-indicator trading signal combining Stochastic RSI, RSI, and MACD to generate buy and sell signals with color-coded strength indicators.
Explore 11,183 indicators. Filter beyond the obvious.
Discover the tools that fit the way you trade.
11,183 tools to explore
A multi-indicator trading signal combining Stochastic RSI, RSI, and MACD to generate buy and sell signals with color-coded strength indicators.
An RSI dashboard tracking momentum across multiple timeframes for five different ticker symbols, helping traders identify potential entry and exit points based on relative strength index values.
An RSI-based indicator that helps traders identify oversold and overbought levels across multiple timeframes, providing visual rays and levels for potential trend pullbacks.
A multi-timeframe indicator that assesses market sentiment by comparing current close prices against 200-period Simple Moving Average across 1-minute and 3-minute intervals.
A dynamic market structure detector that identifies real-time Break of Structure and Change of Character signals, highlighting untested support and resistance zones for precise trading decisions.
A dynamic moving average script that calculates daily moving averages across different intraday chart intervals, automatically adjusting to market-specific trading minutes and timeframes.
A multi-timeframe moving average indicator that plots short, medium, and long moving averages across different fractals, offering customizable visualization and analysis of price trends.
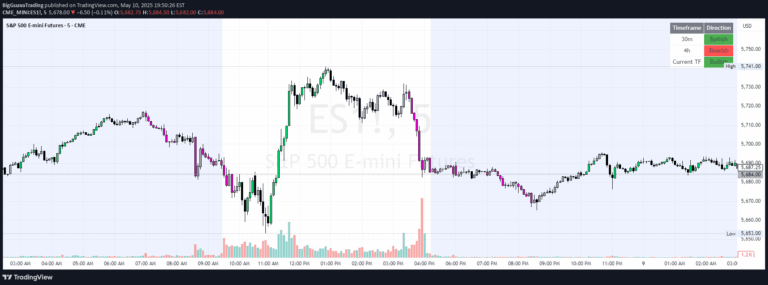
A multi-timeframe indicator that colors chart bars based on candlestick direction alignment across different timeframes, helping traders confirm trend continuity and momentum.
Likes, views, and comments are historical TradingView snapshots. They describe attention, not trading performance.