
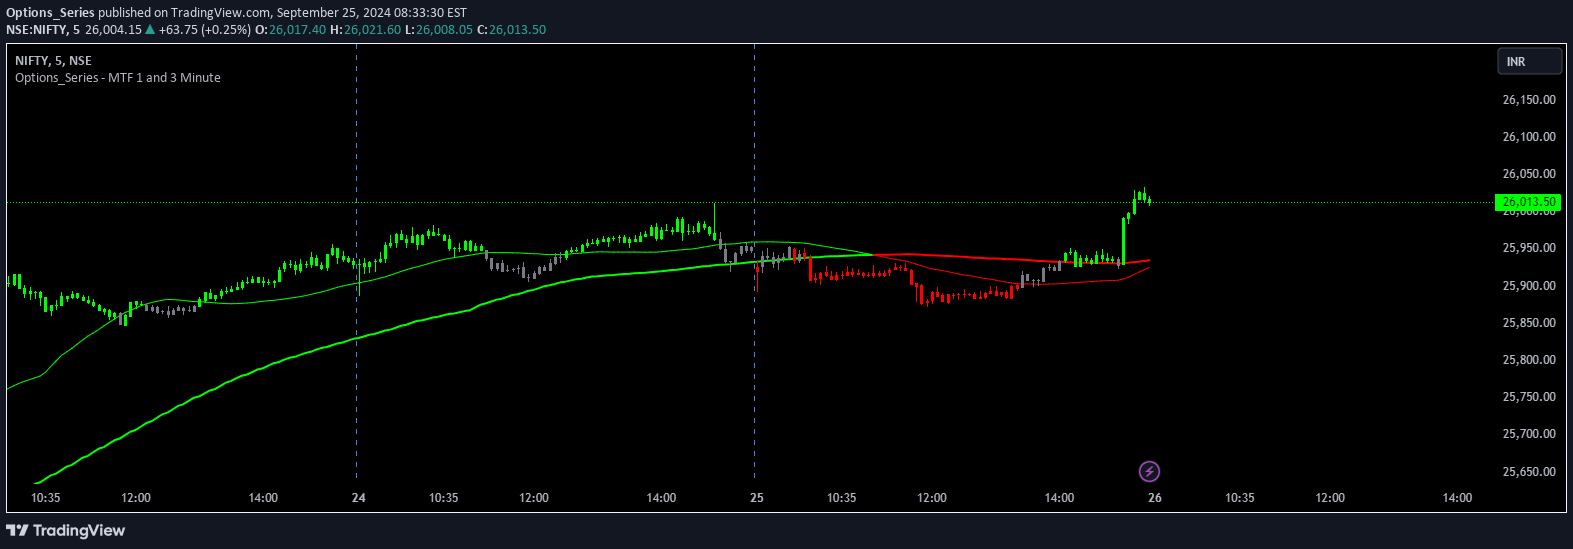
A multi-timeframe indicator that assesses market sentiment by comparing current close prices against 200-period Simple Moving Average across 1-minute and 3-minute intervals.
Explore complementary indicator rolesHow it works
The indicator calculates OHLC values and 200-period Simple Moving Average (SMA) for current, 1-minute, and 3-minute timeframes. It compares the current close price against the previous 200-period SMA close price to determine market sentiment.
Based on these comparisons, the indicator generates color-coded signals: green for bullish conditions where current close price exceeds previous SMA, red for bearish conditions where current close price is below previous SMA, and gray for neutral scenarios.
Why it may be useful
This multi-timeframe approach provides traders with a comprehensive view of market momentum and trend direction across different intervals. By utilizing multiple timeframes, traders can gain deeper insights into potential price movements and market sentiment.
The color-coded visualization makes it easy to quickly interpret market conditions, helping traders make more informed decisions about potential entry and exit points with a clear visual representation of bullish, bearish, and neutral trends.
When to explore it
The indicator is most effective for short-term trading strategies, particularly in fast-moving markets where quick sentiment analysis is crucial. It works best for traders who want to assess market direction across multiple timeframes simultaneously.
Traders can utilize this signal during periods of high market volatility, when rapid trend identification can provide a competitive edge. It is particularly useful for scalping and day trading strategies that require frequent, quick decision-making based on short-term price movements.
Keep exploring
What we’ve verified
Access, alerts and repainting behaviour have not been independently verified for this indicator. Check the creator’s current publication and settings.
General descriptions and classifications are recovered research. Verified details above identify the specific checks we have completed. Check the creator’s current publication for later changes.


