ORB Algo | Flux Charts
An advanced Opening Range Breakout (ORB) indicator that analyzes market trends in the first session minutes, providing precise entry, take-profit, and stop-loss signals.
Explore 11,183 indicators. Filter beyond the obvious.
Discover the tools that fit the way you trade.
11,183 tools to explore
An advanced Opening Range Breakout (ORB) indicator that analyzes market trends in the first session minutes, providing precise entry, take-profit, and stop-loss signals.
A trading calendar indicator that displays daily and monthly market sentiment using three different sentiment calculation methods to help traders quickly assess market direction.
A multi-indicator trading signal combining Stochastic RSI, RSI, and MACD to generate buy and sell signals with color-coded strength indicators.
A weekly RSI indicator that identifies potential buy and sell opportunities by tracking momentum through oversold and overbought levels on the 14-period RSI.
Hull Waves indicator uses Hull Moving Averages to identify market trends and potential entry/exit points by analyzing price movements through dynamic visual lines and moving average crossovers.
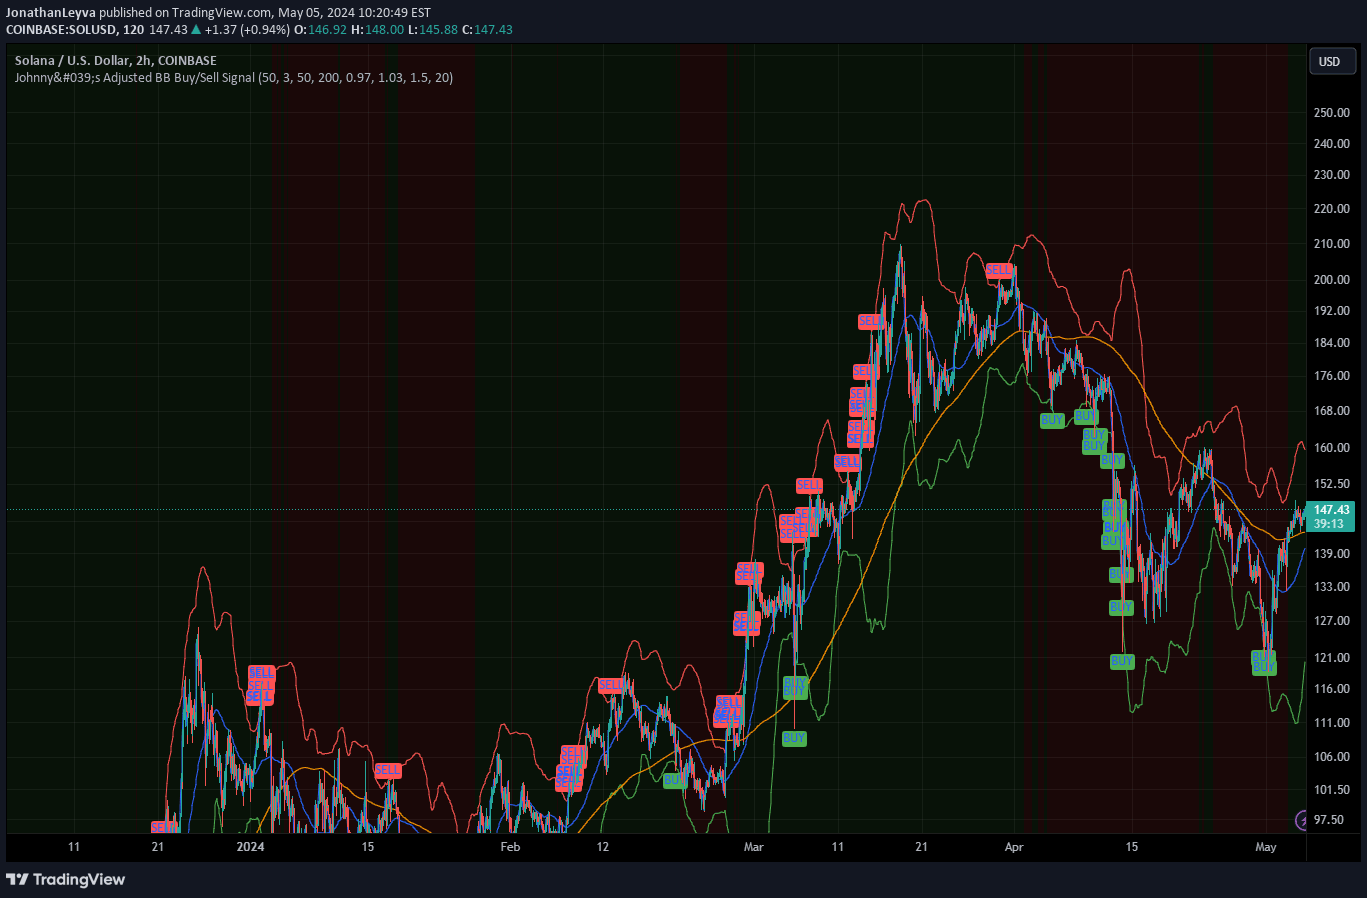
A dynamic trading signal using Bollinger Bands and moving averages to identify strategic entry and exit points by analyzing market volatility and trend conditions.
An advanced trend detection indicator that combines dynamic G-Channels with RSI confirmation to help traders identify potential buy and sell opportunities across various financial markets.
A dynamic RSI indicator that automatically adjusts overbought and oversold levels based on market conditions, providing more accurate trading signals and visual alerts.
A dynamic EMA crossover indicator that identifies market trends and sideways zones using two customizable exponential moving averages with color-coded visual signals.
A dual moving average crossover indicator that identifies potential trend reversals by tracking the interaction between fast and slow moving averages.
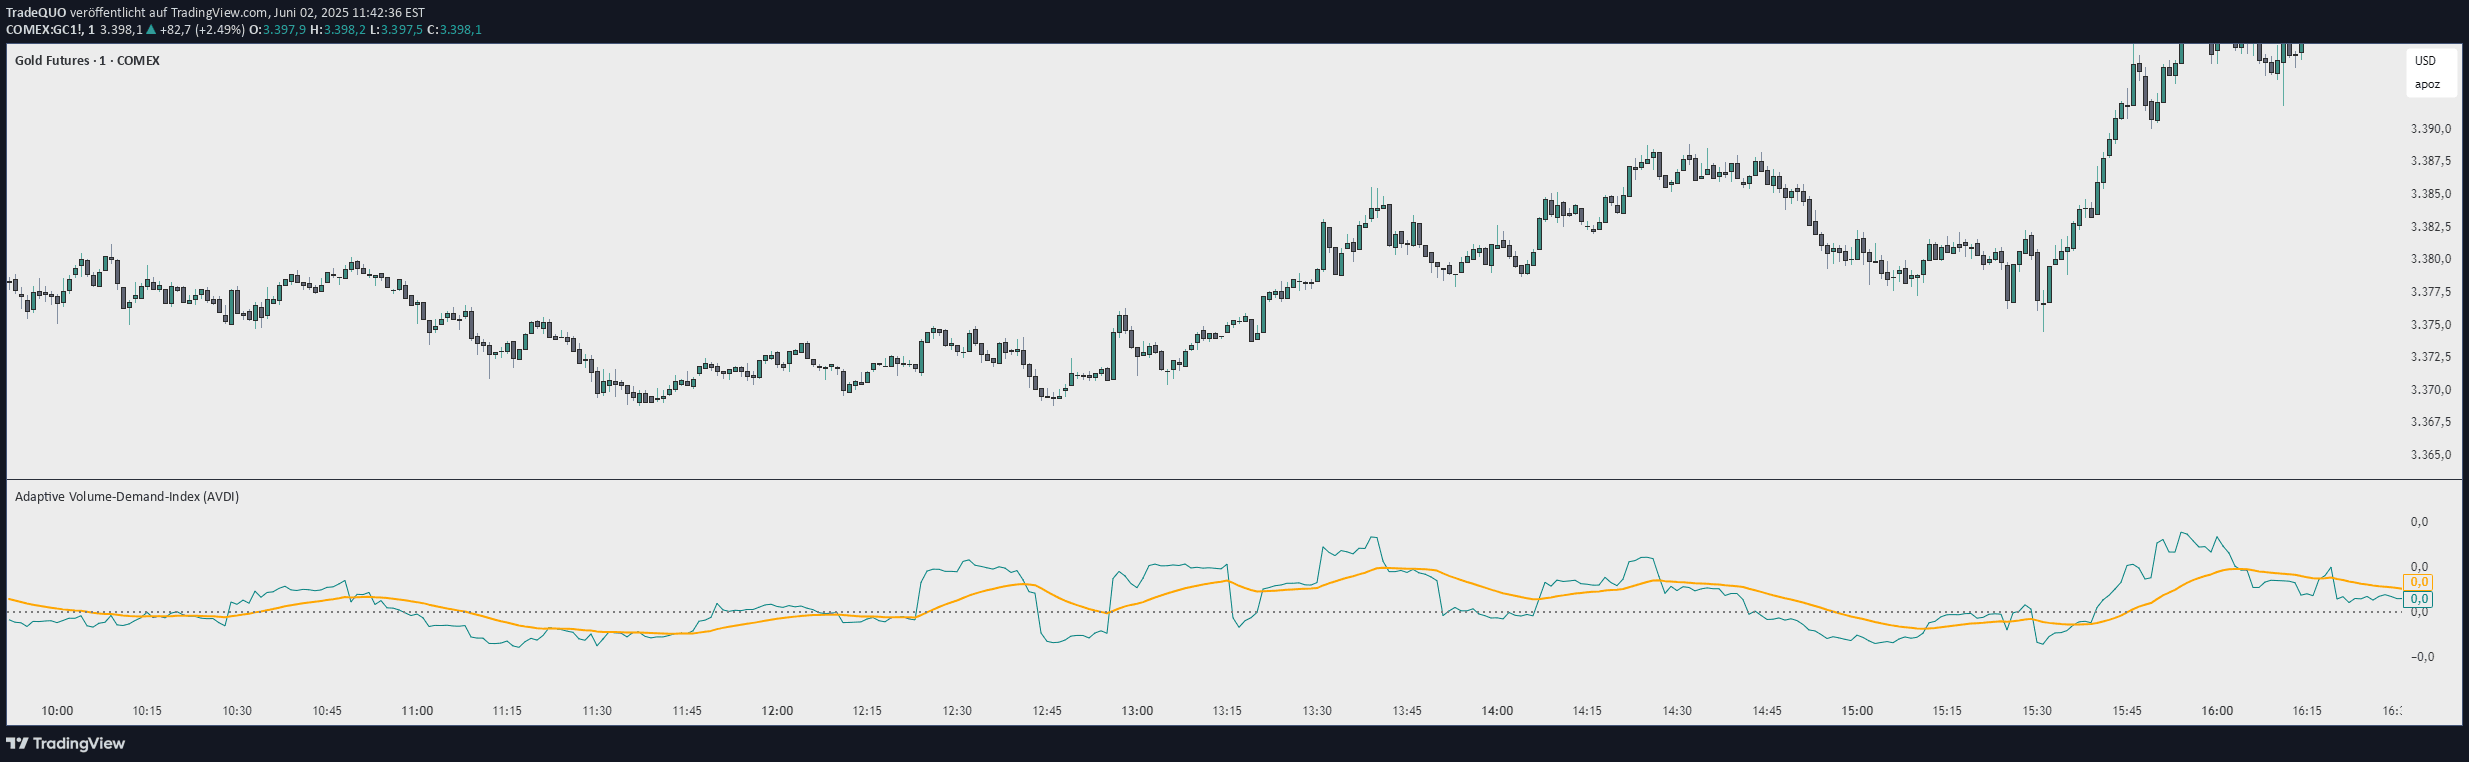
The Demand Index analyzes volume and price to measure buying and selling strength, providing insights into market dynamics and potential trend reversals.
Likes, views, and comments are historical TradingView snapshots. They describe attention, not trading performance.