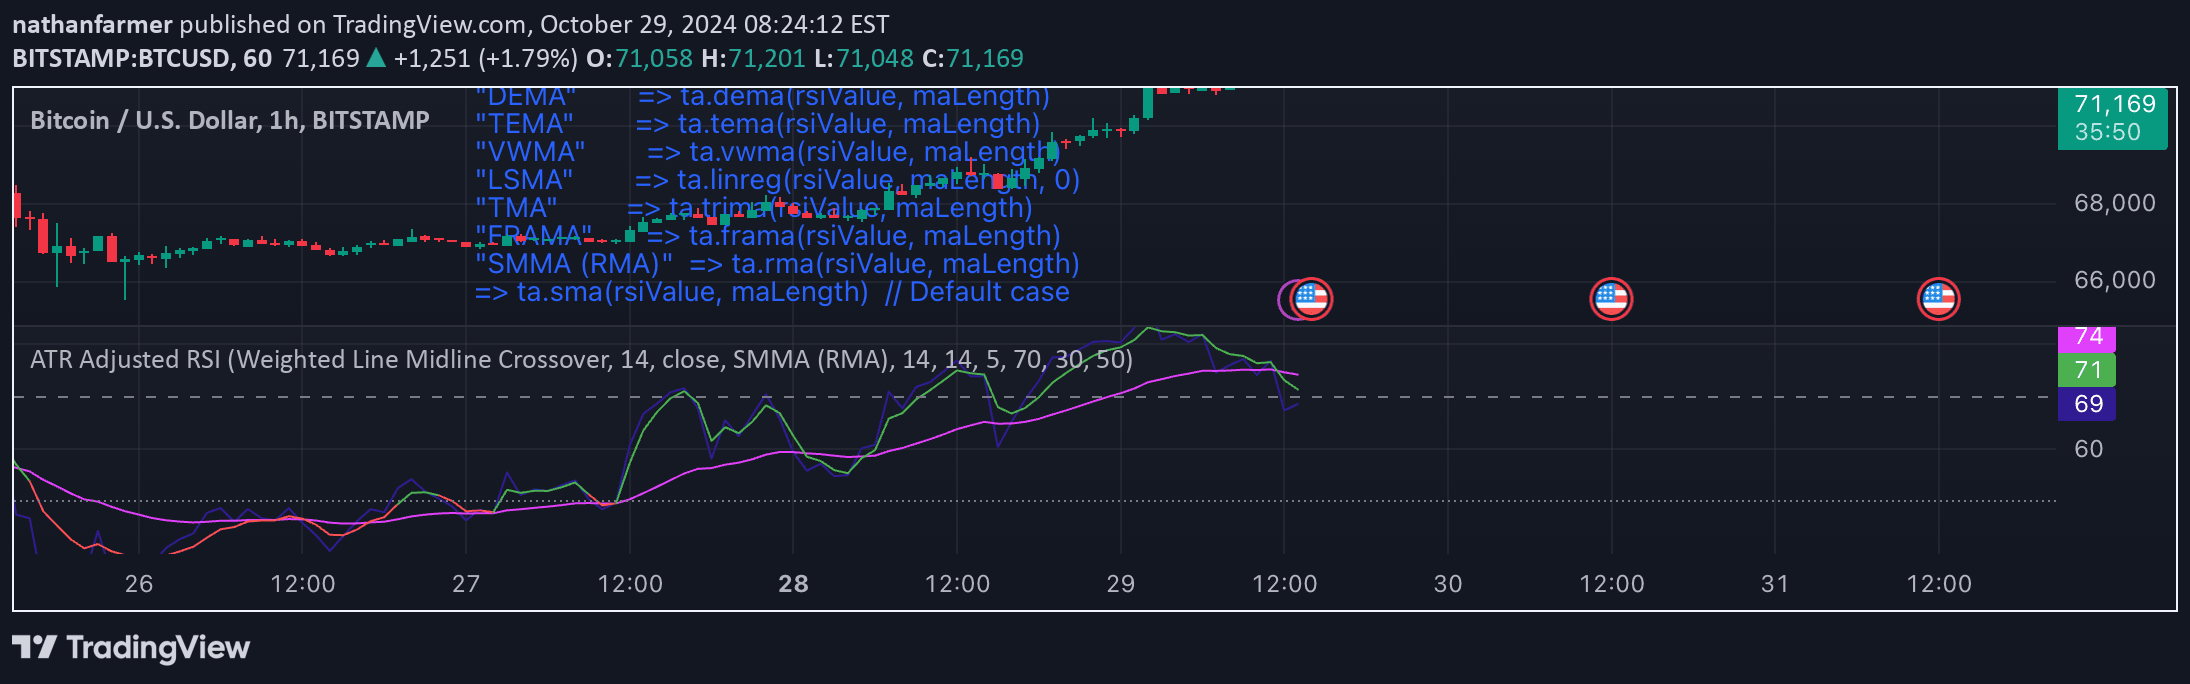
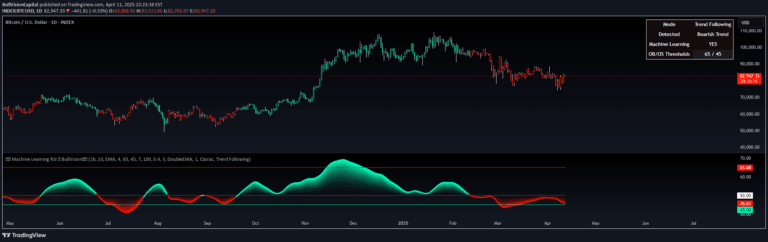
A dynamic RSI indicator that automatically adjusts overbought and oversold levels based on market conditions, providing more accurate trading signals and visual alerts.
Explore complementary indicator rolesHow it works
The Dynamic RSI indicator calculates the Relative Strength Index by measuring the magnitude of recent price changes to evaluate overbought or oversold conditions. Unlike traditional RSI, this version dynamically adjusts its overbought and oversold levels based on the highest and lowest RSI values within a user-defined period, creating more responsive and adaptive threshold lines.
The indicator plots horizontal lines representing these dynamic levels, with the overbought zone typically colored red and the oversold zone colored green. When the RSI crosses these lines, it generates visual signals that help traders identify potential market reversals or price pullback opportunities.
Why it may be useful
The Dynamic RSI provides traders with a more nuanced and context-aware approach to measuring market momentum compared to traditional fixed-level RSI indicators. By automatically adapting its overbought and oversold thresholds, it offers more precise signals that reflect current market conditions, reducing false signals and improving trading decision-making.
The visual elements like color-coded background changes and clear horizontal lines make it easier for traders to quickly interpret market states, allowing for faster and more intuitive recognition of potential trading opportunities across different timeframes and market environments.
When to explore it
This indicator works best on timeframes that experience more rapid market shifts, such as 30-minute and 1-hour charts where price momentum can change quickly. Traders can utilize the Dynamic RSI to identify potential trend reversals, assess market sentiment, and spot opportunities for entering or exiting trades based on momentum signals.
It is particularly useful during periods of market volatility, helping traders recognize when an asset might be overextended in either direction. The dynamic nature of the indicator makes it adaptable to different market conditions, providing valuable insights for scalpers, day traders, and swing traders seeking to capture short to medium-term price movements.
Keep exploring
What we’ve verified
Access, alerts and repainting behaviour have not been independently verified for this indicator. Check the creator’s current publication and settings.
General descriptions and classifications are recovered research. Verified details above identify the specific checks we have completed. Check the creator’s current publication for later changes.