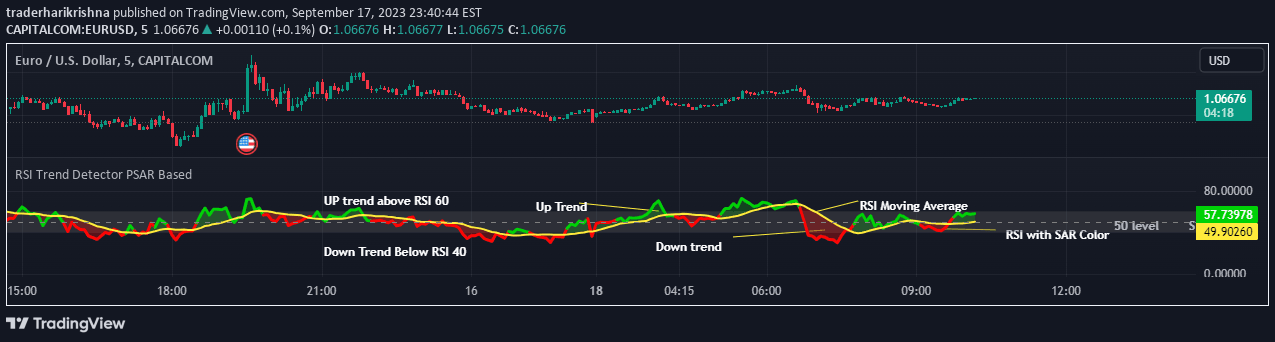
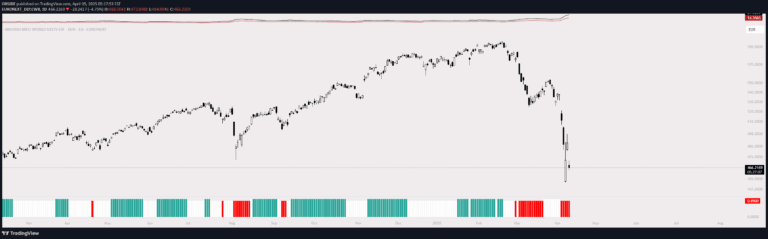
RSI Trend Filter that visualizes trend direction and conditions by scaling RSI on the chart, revealing hidden divergence and providing clear oversold/overbought signals.
Explore complementary indicator rolesHow it works
The RSI Trend Filter transforms the traditional RSI oscillator into a chart-based visualization that tracks price momentum and trend direction. It plots the RSI against a 50-level reference point connected to the EMA50, creating a cloud-like representation that helps traders quickly interpret market conditions.
By color-coding and positioning the RSI relative to the 50 level, traders can instantly recognize uptrends, downtrends, and sideways markets. The indicator automatically marks oversold and overbought conditions, simplifying trend analysis and reducing the complexity of traditional RSI interpretation.
Why it may be useful
The RSI Trend Filter provides traders with a more intuitive and visually accessible way to understand market momentum and potential trend reversals. By transforming the RSI into a chart-based tool, it eliminates much of the confusion associated with traditional oscillator readings and makes trend identification more straightforward.
This approach allows traders to quickly assess market conditions, identify potential entry and exit points, and recognize hidden divergences that might be less apparent in standard RSI representations. The visual clarity helps traders make more informed decisions by presenting complex momentum data in an easily digestible format.
When to explore it
The RSI Trend Filter is most effective in markets with clear trending or ranging conditions, where momentum plays a significant role in price movement. It works particularly well in liquid markets with consistent price action, such as major forex pairs, stock indices, and prominent cryptocurrency pairs.
Traders should use this indicator in conjunction with other technical analysis tools to confirm signals and validate potential trade setups. It is especially useful during periods of moderate volatility when trend strength and momentum are key considerations for trading decisions.
Keep exploring
What we’ve verified
Access, alerts and repainting behaviour have not been independently verified for this indicator. Check the creator’s current publication and settings.
General descriptions and classifications are recovered research. Verified details above identify the specific checks we have completed. Check the creator’s current publication for later changes.