Beep Boop is a simplified trading indicator that combines MACD and EMA to provide clear visual cues about market momentum and trend direction using binary histogram visualization.
Explore complementary indicator rolesHow it works
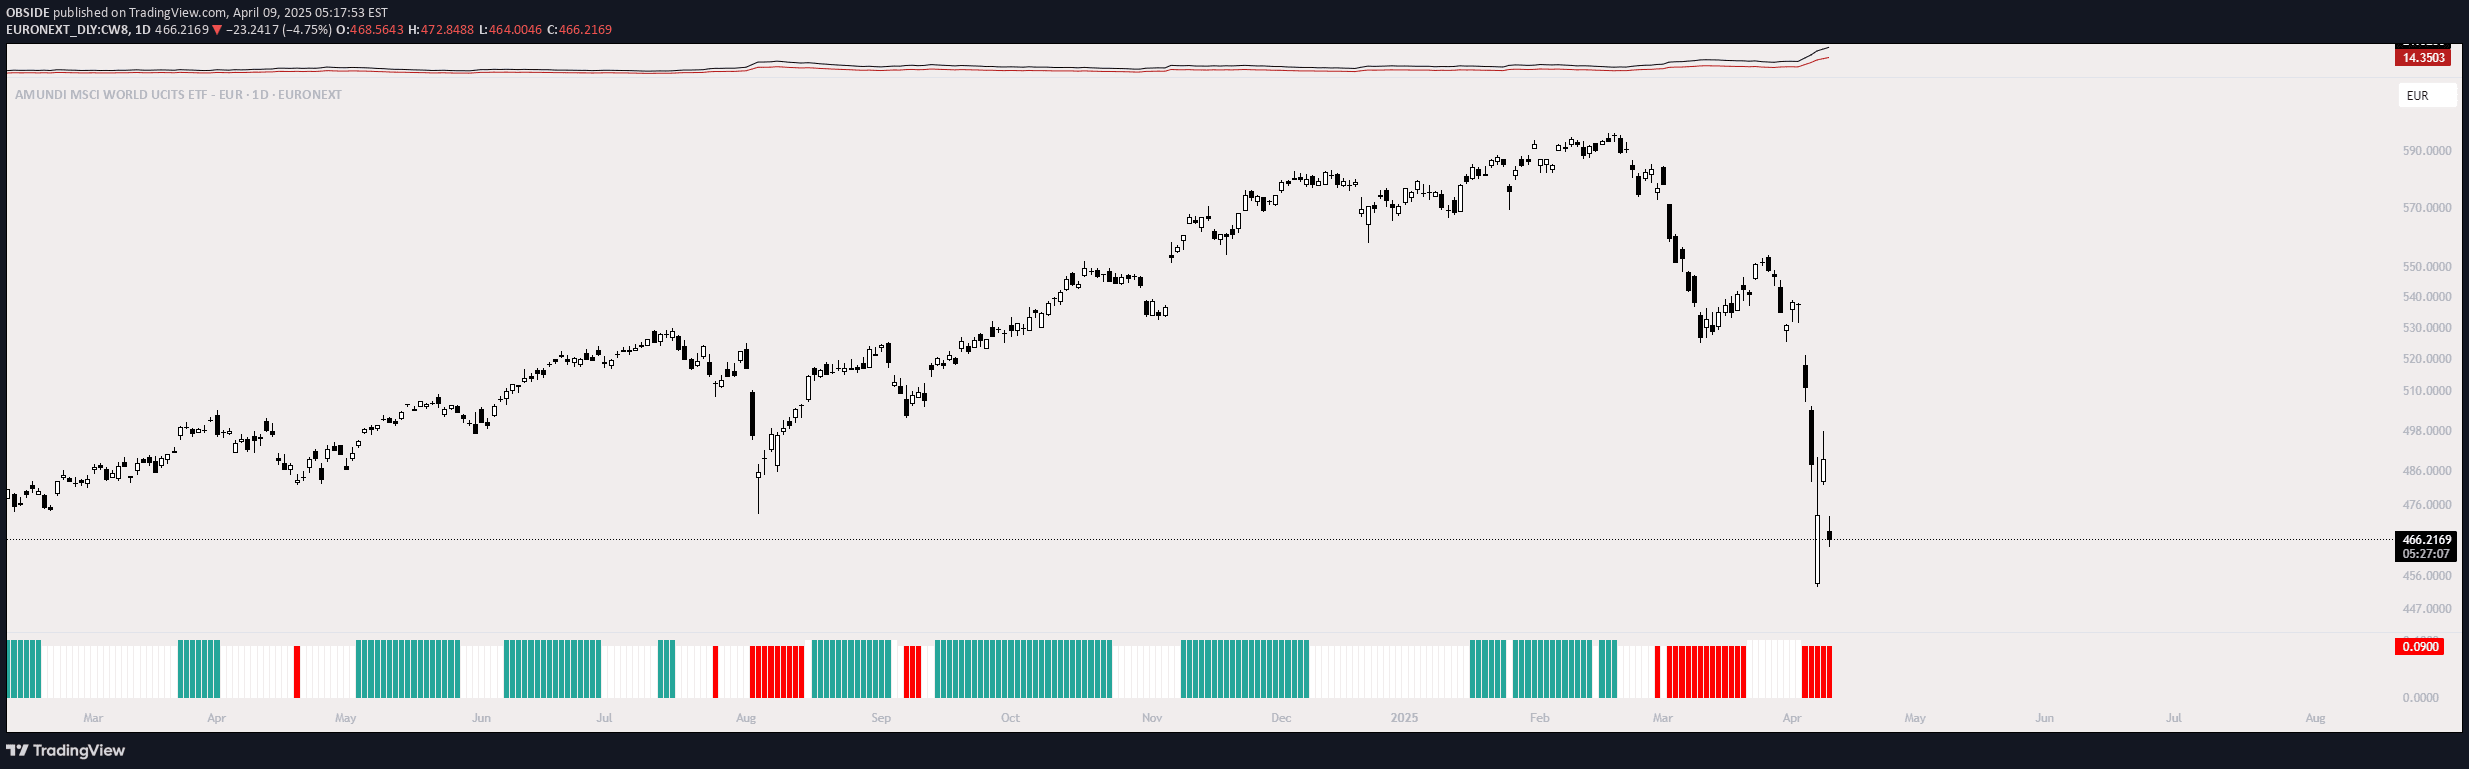
The Beep Boop indicator works by modifying the traditional MACD histogram into a binary visualization system. It assigns fixed positive (0.1) or negative (0. 09) values to represent bullish or bearish momentum.
The indicator incorporates an Exponential Moving Average (EMA) as a trend filter, comparing current price action to the EMA line. Green bars indicate bullish momentum when price is above the EMA, red bars show bearish momentum when price is below the EMA, and white bars represent neutral or uncertain market conditions
Why it may be useful
The Beep Boop indicator simplifies complex market analysis by providing an intuitive, at-a-glance view of market momentum and trend direction. By reducing the traditional MACD's complex histogram to a binary system, it makes it easier for traders to quickly interpret market conditions.
The integrated EMA filter adds an extra layer of trend confirmation, helping traders distinguish between meaningful momentum shifts and temporary price fluctuations. This approach reduces analytical complexity and allows for faster decision-making in dynamic trading environments
When to explore it
The Beep Boop indicator is most effective in trending markets with clear directional movements. It works best for traders seeking quick momentum assessments across various timeframes. Scalpers and day traders can use it for rapid entry and exit decisions, while swing traders can leverage its trend-following capabilities for longer-term position sizing.
The indicator is particularly useful during stable market conditions where trend persistence is more predictable. Traders should combine it with other technical and fundamental analysis tools for comprehensive market evaluation
Keep exploring
What we’ve verified
Access, alerts and repainting behaviour have not been independently verified for this indicator. Check the creator’s current publication and settings.
General descriptions and classifications are recovered research. Verified details above identify the specific checks we have completed. Check the creator’s current publication for later changes.