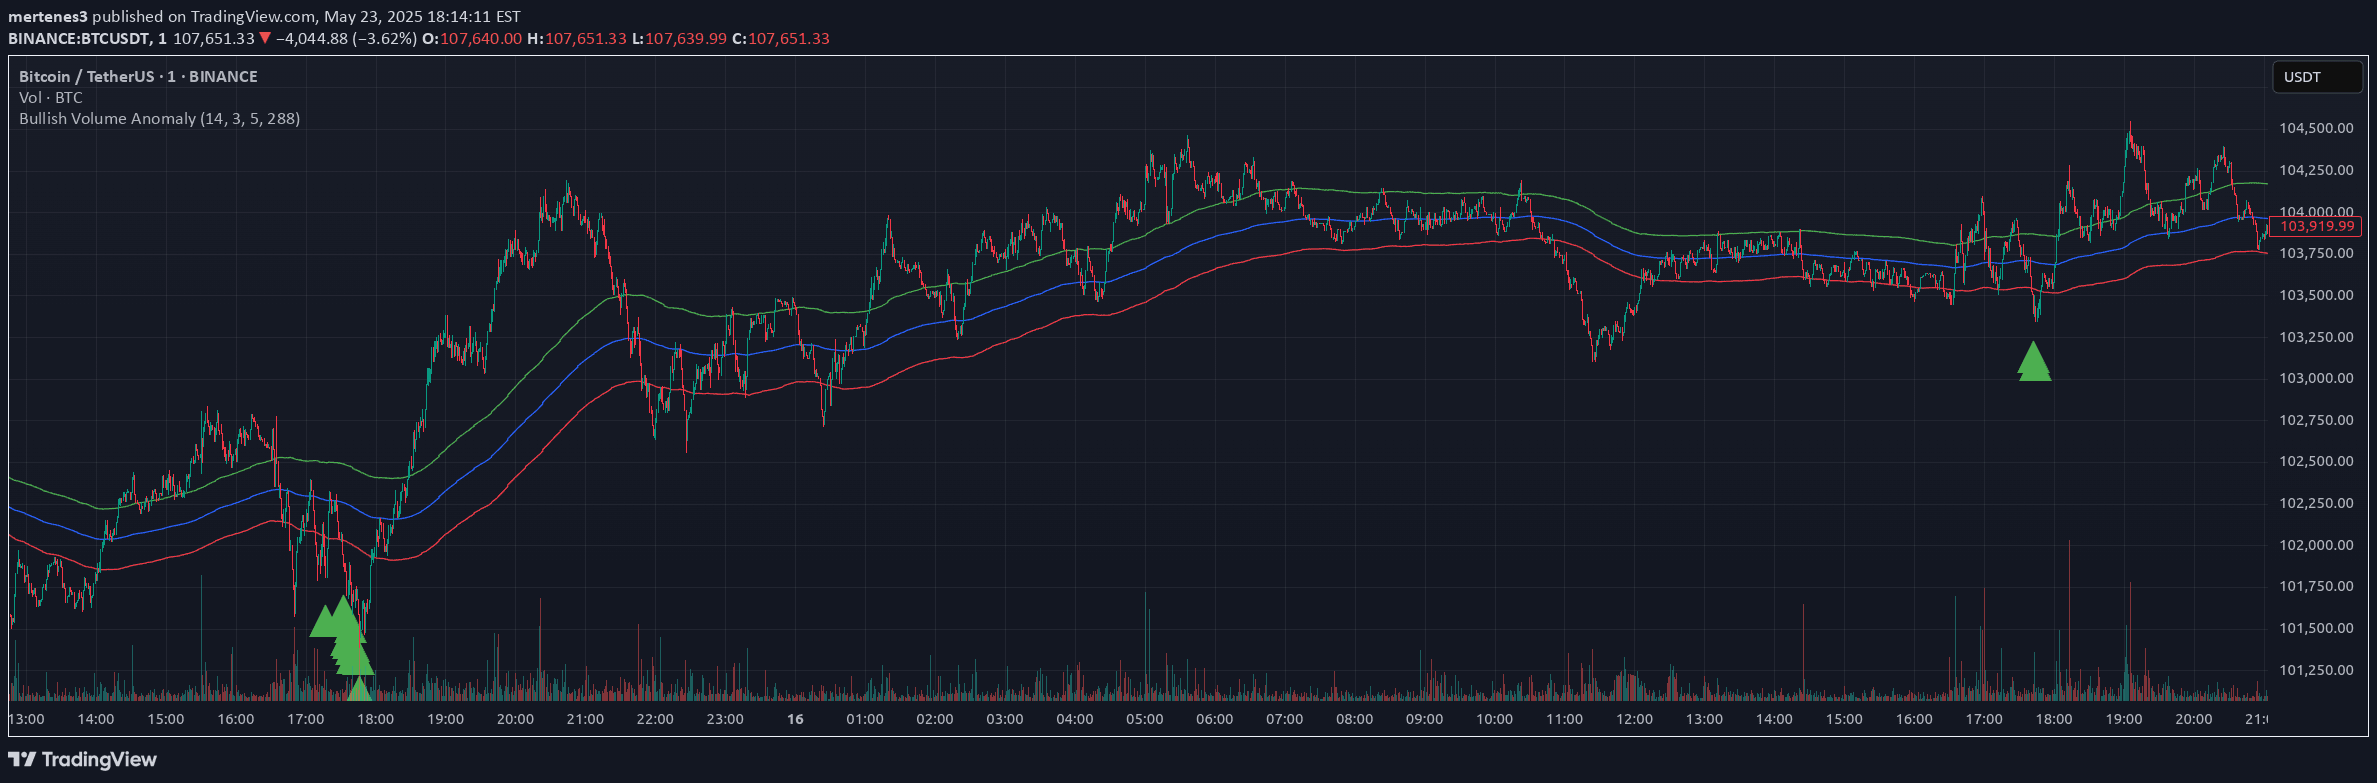
A candlestick body analysis indicator that measures bullish and bearish price movement strength by calculating total body sizes and presenting a bull/bear ratio.
Explore complementary indicator rolesHow it works
The indicator calculates the total body sizes of bullish and bearish candles over a specified lookback period, providing a comprehensive view of price movement dynamics. It does this by measuring the actual price range within each candle's body, differentiating between upward and downward price movements.
By comparing these body sizes, the indicator generates a bull/bear ratio, which represents the relative strength of bullish versus bearish momentum. The tool can also normalize these measurements using Average True Range (ATR) to ensure consistent analysis across different market volatility levels.
Why it may be useful
This indicator provides traders with a nuanced perspective on market momentum by analyzing actual price movement rather than simply counting candles. It offers deeper insights into market sentiment by quantifying the strength of bullish and bearish price actions, allowing traders to make more informed decisions.
By presenting both visual and numerical data, the indicator helps traders understand underlying market dynamics beyond traditional technical analysis methods. The bull/bear ratio and background color coding make it easy to quickly assess current market conditions and potential trend strength.
When to explore it
The indicator is most effective in markets with clear directional movements and during periods of established trends. It works particularly well in liquid markets with consistent price action, such as major forex pairs, stock indices, and heavily traded commodities.
Traders should pay special attention when the bull/bear ratio approaches extreme values, such as above 2 (strong bullish signal) or below 0.5 (strong bearish signal). These extreme readings can signal potential trend continuation or potential reversal points, making the indicator valuable for trend-following and trend-reversal strategies.
Keep exploring
What we’ve verified
Access, alerts and repainting behaviour have not been independently verified for this indicator. Check the creator’s current publication and settings.
General descriptions and classifications are recovered research. Verified details above identify the specific checks we have completed. Check the creator’s current publication for later changes.