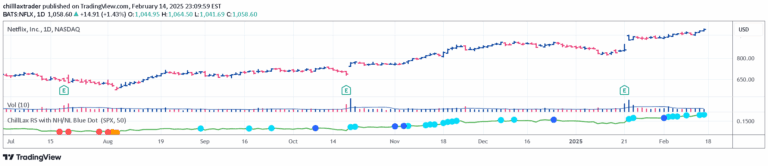
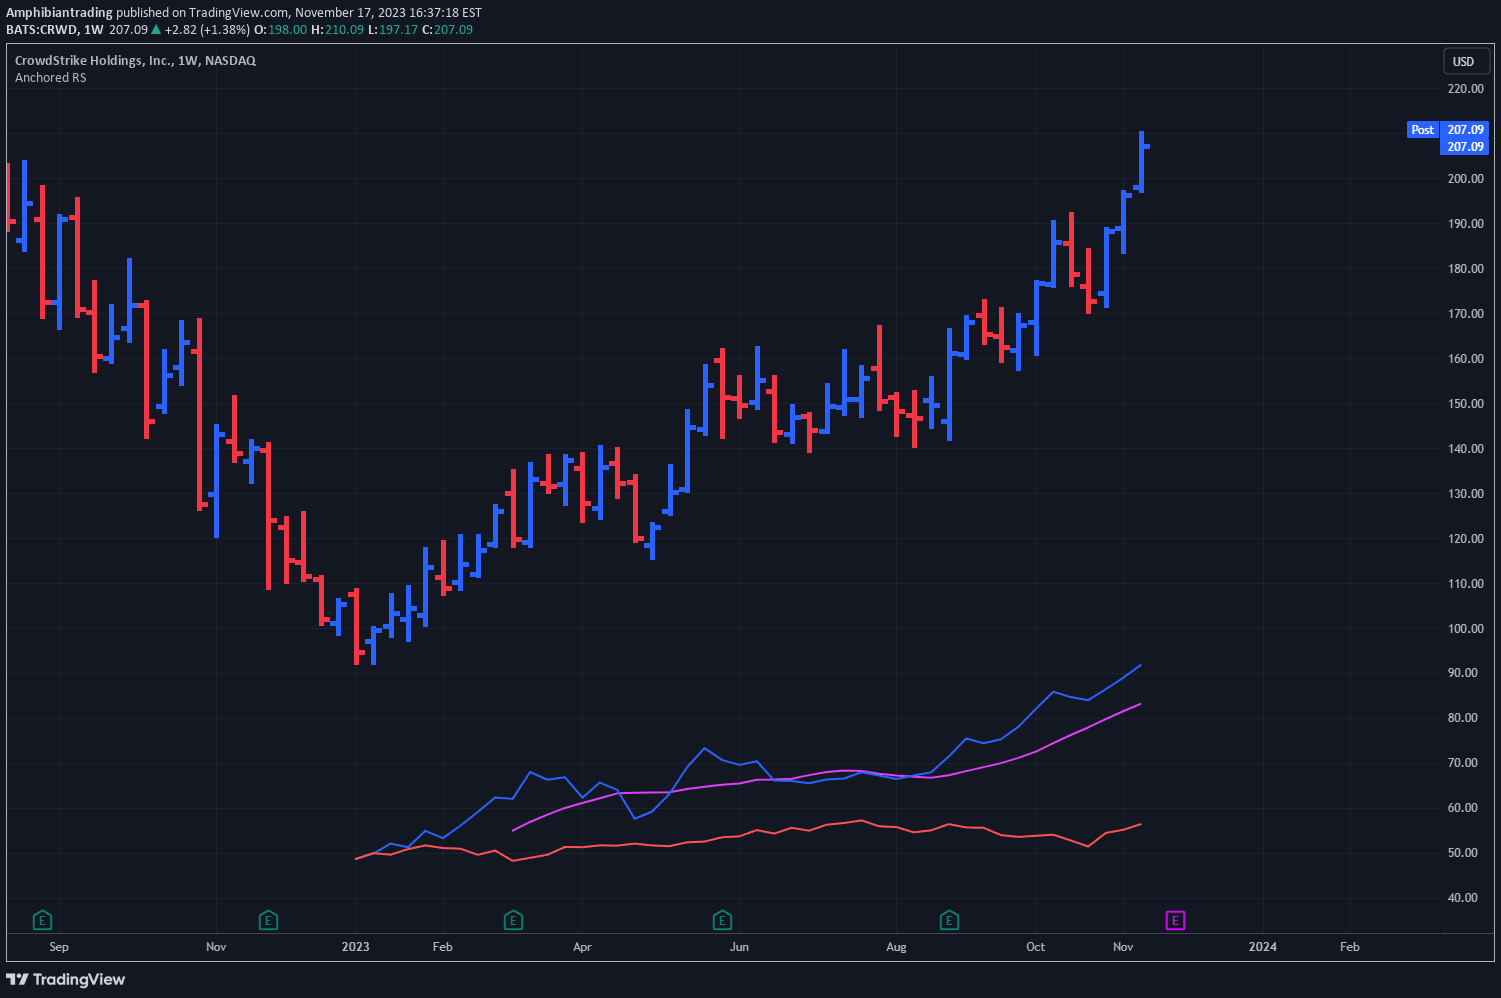
Relative strength measures a stock's price performance compared to a market index, revealing how an asset performs relative to a benchmark over a specific time period.
Explore complementary indicator rolesHow it works
Relative strength is calculated by dividing a stock's price change over a specific period by the market's price change during the same timeframe. The resulting ratio provides a comparative performance metric that shows how an asset has performed relative to a chosen benchmark index or sector.
By tracking this ratio, traders can identify stocks that are outperforming or underperforming the market. The indicator uses color coding to represent different performance levels, with red indicating underperformance, yellow showing emerging momentum, green signaling outperformance, and blue representing exceptional performance compared to the benchmark.
Why it may be useful
Relative strength provides traders with an objective, quantitative measure of an asset's performance, helping to reduce emotional bias in investment decisions. By comparing an asset's performance against a benchmark, investors can quickly identify the strongest performers within a sector or market.
This indicator helps traders make more informed decisions by offering a comprehensive view of an asset's relative performance. It can be used in conjunction with other technical analysis tools to identify potential trading opportunities and assess an asset's momentum and trend strength.
When to explore it
Relative strength is most effective when used on daily and weekly timeframes for various assets, including stocks, cryptocurrencies, and market indices. Traders should carefully select an appropriate reference index that matches the asset being analyzed, such as using TOTAL for cryptocurrencies or DAX for German stocks.
The indicator is particularly useful when evaluating potential breakout opportunities, especially when the relative strength turns positive and remains stable. It can help identify assets that are likely to continue outperforming the market in the short to medium term, making it valuable for momentum and trend-following trading strategies.
Keep exploring
What we’ve verified
Access, alerts and repainting behaviour have not been independently verified for this indicator. Check the creator’s current publication and settings.
General descriptions and classifications are recovered research. Verified details above identify the specific checks we have completed. Check the creator’s current publication for later changes.