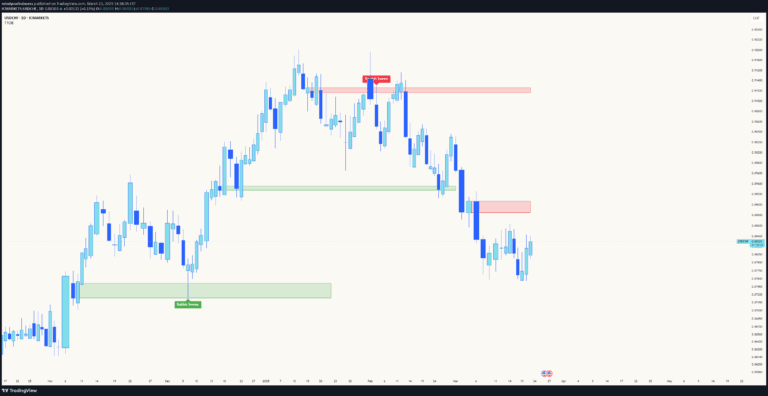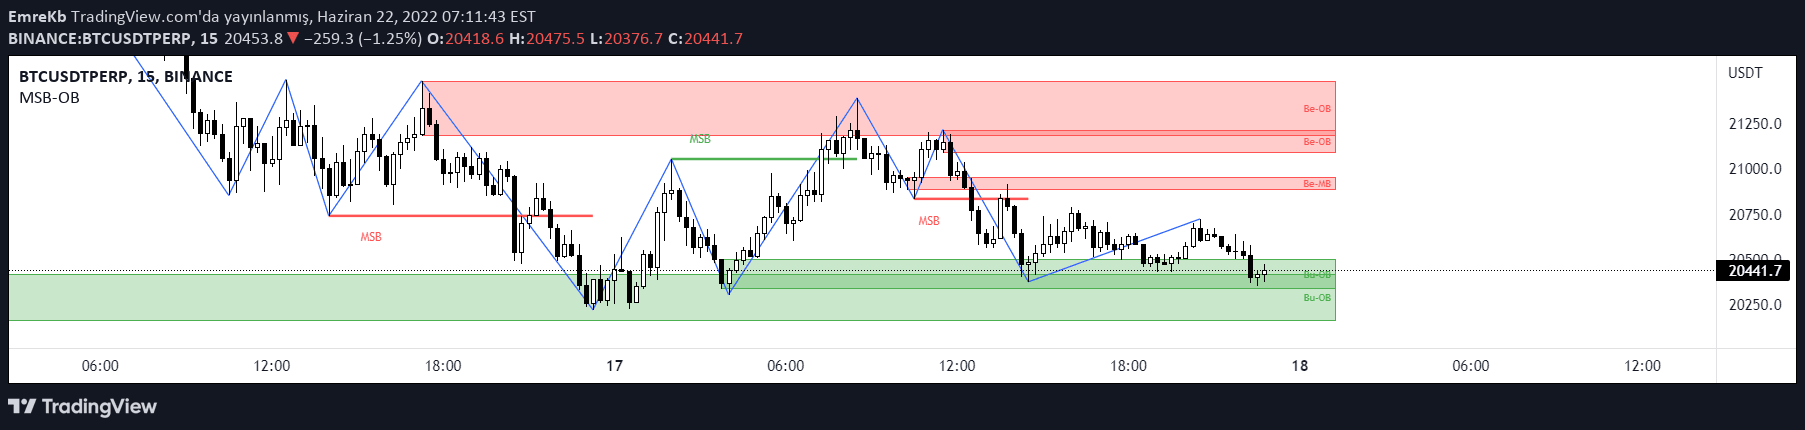
A market structure break and order block indicator that identifies trend reversals by analyzing price action breakouts and key candle formations to signal potential trading opportunities.
Explore complementary indicator rolesHow it works
The indicator first identifies market structure breaks (MSB) by tracking price movements that break previous high or low levels. After a breakout, it looks for specific price action patterns like making higher highs or lower lows.
Order blocks are then determined by finding the last bullish or bearish candle before a significant price level. The zigzag length helps calculate these critical points, while the Fibonacci factor confirms breakout strength by comparing new highs and lows against predefined levels
Why it may be useful
This indicator helps traders identify potential trend reversals and key entry points by analyzing market structure and order flow. By highlighting critical price levels and breakout confirmations, it provides insights into market sentiment and potential momentum shifts.
Traders can use these signals to make more informed decisions about trend changes, entry and exit points, and overall market dynamics. The combination of market structure breaks and order blocks offers a comprehensive view of price action
When to explore it
The indicator works best in trending markets with clear price action patterns. It is most effective on timeframes that capture meaningful market movements, such as daily or 4-hour charts.
Traders should use this signal when seeking to confirm trend reversals, identify potential breakout opportunities, and understand underlying market structure. It is particularly useful during periods of market transition, when price is moving between consolidation and trending phases
Keep exploring
What we’ve verified
Reviewed 2026-10-20 · Published Pine v5 source; publication updated 8 May 2023
- Access
- Free, open-source publicationSource checked
The published Pine code is available to read on TradingView.
- Alerts
- Structure-break and zone-entry alertsSource checked
The code includes a market-structure-break alert condition and alert calls when price enters bullish or bearish zones.
- Repainting & timing
- Swing drawings use earlier candlesSource checked
The code detects swings before drawing lines and order-block boxes at historical candle positions. A marker’s position is not its original detection time. Current-bar high/low values can also change.
Source review of alert definitions and swing drawing timing. Historical markers were not validated in bar replay.
Review the creator’s publication ↗General descriptions and classifications are recovered research. Verified details above identify the specific checks we have completed. Check the creator’s current publication for later changes.