A trading indicator that marks price breakouts by identifying candles that close above or below the highest or lowest points of the previous three candles.
Explore complementary indicator rolesHow it works
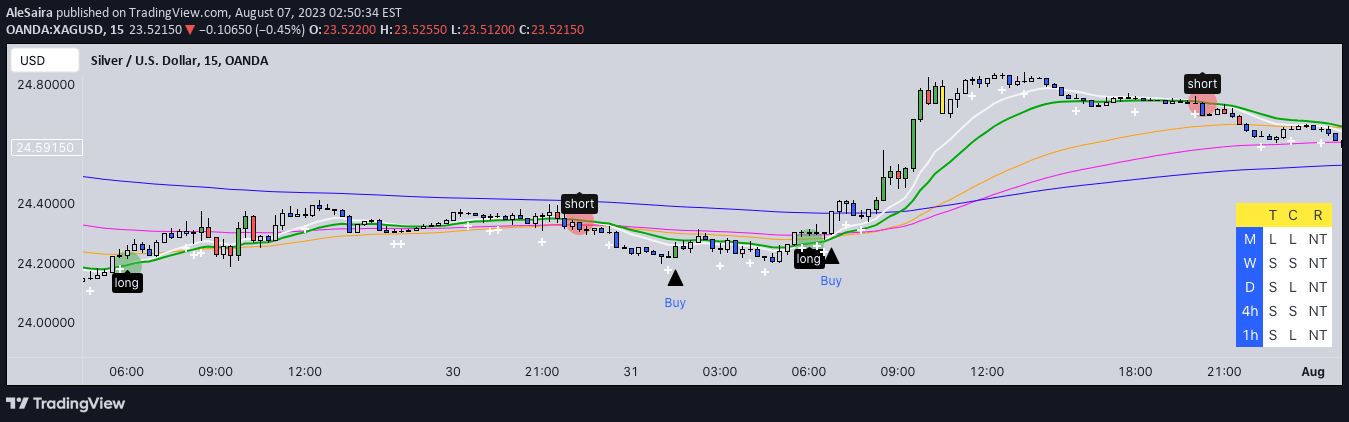
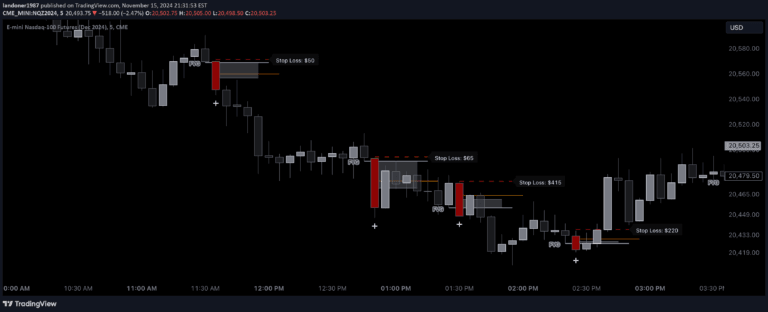
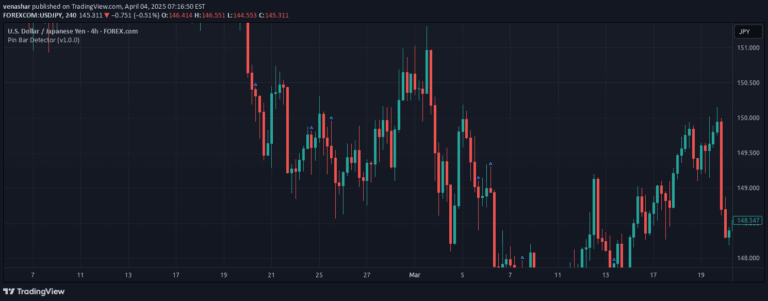
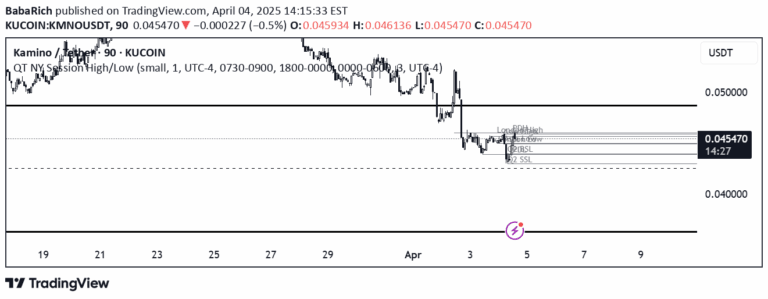
The Three Candle Breakout Marker analyzes price action by comparing the current candle's close price to the highest and lowest points of the previous three candles. When a candle closes above the highest high of the last three candles, a blue upward triangle is plotted, signaling a potential bullish breakout.
Conversely, when a candle closes below the lowest low of the previous three candles, an orange downward triangle is displayed, indicating a potential bearish breakout. The indicator provides visual markers that help traders quickly identify momentum shifts and potential trend changes. By focusing on recent price action, the marker offers a dynamic way to track short-term price movements and potential breakout opportunities across different timeframes and trading styles.
Why it may be useful
The Three Candle Breakout Marker is crucial for traders seeking to capitalize on rapid market movements and momentum shifts. By providing clear visual signals, the indicator helps traders quickly identify potential entry and exit points without complex calculations or extensive technical analysis.
The simplicity of the marker allows traders to make faster, more informed decisions based on recent price action. Moreover, the indicator's flexibility makes it valuable across different trading styles and asset classes. Traders can easily customize the marker's appearance and integrate it with other technical analysis tools to enhance their overall trading strategy and improve decision-making processes.
When to explore it
The Three Candle Breakout Marker is most effective in markets with clear momentum and distinct price movements. It works exceptionally well in highly liquid markets like forex, stocks, and cryptocurrency, where short-term price fluctuations are common and significant. Traders should use this indicator during periods of active trading with sufficient price volatility to generate meaningful signals.
The marker is particularly useful during trending market conditions, whether bullish or bearish, as it can help identify potential continuation or reversal points. Traders should combine this indicator with other technical analysis tools like support and resistance levels, volume indicators, and trend-following indicators to validate signals and improve overall trading accuracy.
Keep exploring
What we’ve verified
Access, alerts and repainting behaviour have not been independently verified for this indicator. Check the creator’s current publication and settings.
General descriptions and classifications are recovered research. Verified details above identify the specific checks we have completed. Check the creator’s current publication for later changes.