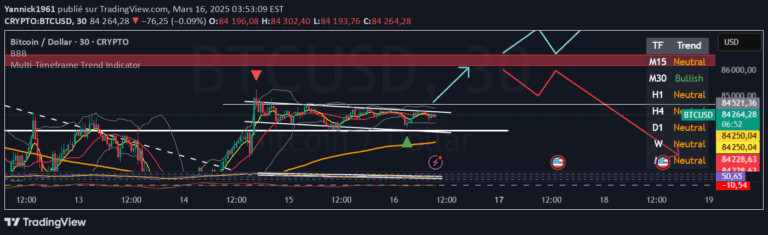
A multi-timeframe trading dashboard that provides real-time directional analysis across five timeframes, assessing price action, trend alignment, and confidence strength.
Explore complementary indicator rolesHow it works
The MTF Candle Direction Forecast analyzes price dynamics by examining multiple timeframe indicators including candle body-to-range ratio, EMA9/EMA20 structure, and VWAP placement. It computes a confidence score between 0-100 that reflects the current candle's momentum and trend alignment.
The system generates a visual dashboard that color-codes and icons each timeframe's directional bias, showing whether the current trend is bullish, bearish, or neutral. By processing live candle data without lookahead bias, the indicator provides an instant snapshot of market structure across different time intervals.
Why it may be useful
This tool offers traders a comprehensive, real-time view of market dynamics that goes beyond traditional lagging indicators. By quantifying trend strength and providing visual cues, it helps traders quickly assess market conditions and filter out low-probability trade setups.
The confidence scoring mechanism allows traders to understand not just direction, but the reliability of that directional move. This helps minimize entering trades during uncertain market conditions and provides a more nuanced approach to trend analysis than simple binary trend indicators.
When to explore it
The MTF Candle Direction Forecast is most effective when traders need a quick, multi-timeframe perspective on market momentum and trend alignment. It's particularly useful during volatile market conditions where understanding trend strength across different timeframes can provide critical trading insights.
Traders can leverage this tool for confirming trend direction, identifying potential entry and exit points, and understanding the overall market structure. It's especially valuable for strategies that require a comprehensive view of price action across multiple time intervals, from scalping to swing trading.
Keep exploring
What we’ve verified
Access, alerts and repainting behaviour have not been independently verified for this indicator. Check the creator’s current publication and settings.
General descriptions and classifications are recovered research. Verified details above identify the specific checks we have completed. Check the creator’s current publication for later changes.