
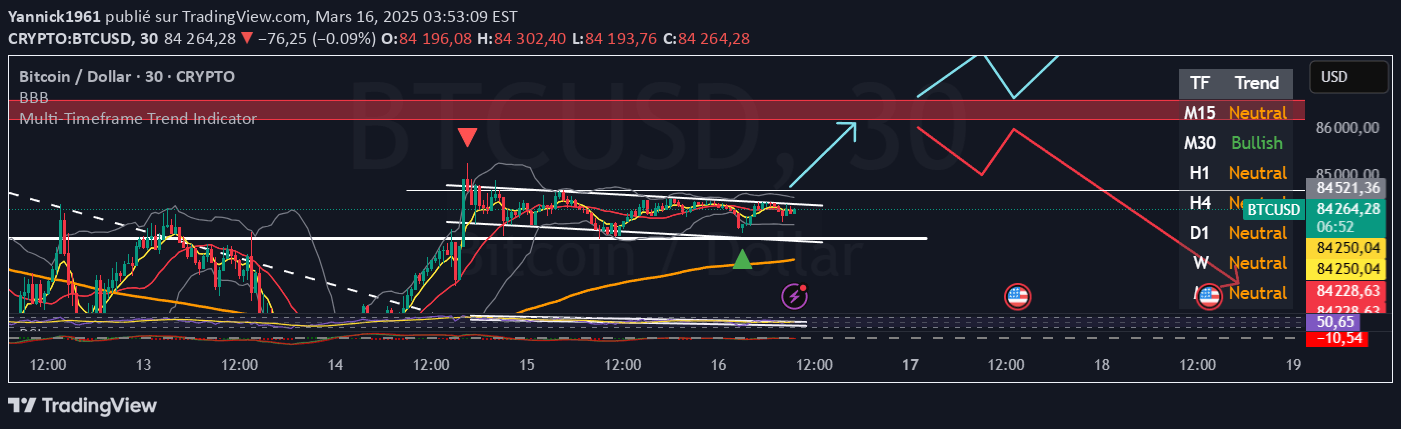
A multi-timeframe trend indicator that analyzes market direction across five key timeframes using EMA and SMA crossovers for comprehensive trading insights.
Explore complementary indicator rolesHow it works
The Multi-Timeframe Trend Indicator operates by simultaneously analyzing five critical timeframes: H1, H4, D1, W, and M. It utilizes a systematic approach of comparing three moving averages: EMA7, SMA20, and SMA200 to determine market trend direction. The indicator generates clear trend signals by examining the relative positioning of these moving averages.
When the EMA7 is above SMA20 and SMA200, it signals a bullish trend, indicating potential upward momentum. Conversely, when the EMA7 falls below SMA20 and SMA200, it indicates a bearish trend, suggesting potential downward price movement. Any other configuration results in a neutral trend, providing traders with a comprehensive view of market dynamics across multiple timeframes.
Why it may be useful
The Multi-Timeframe Trend Indicator is crucial for traders seeking a holistic approach to market analysis. By providing insights across multiple timeframes, it helps traders align their strategies with broader market trends and reduce the risk of trading against the primary market direction. The color-coded display enables quick and intuitive trend recognition, allowing traders to make more informed decisions.
Moreover, this indicator bridges the gap between short-term and long-term market perspectives. It helps traders confirm their trading decisions by comparing trends across different timeframes, potentially increasing the probability of successful trades. The comprehensive approach reduces emotional trading and promotes a more systematic, data-driven trading strategy.
When to explore it
The Multi-Timeframe Trend Indicator is most effective when traders want to gain a comprehensive understanding of market trends across different time horizons. It is particularly useful during periods of market transition or when traders are looking to confirm the strength and direction of a potential trend. The indicator can help identify potential trend reversals and provide early warning signals for changing market conditions.
Traders should utilize this tool when they want to minimize the impact of short-term market noise and focus on more significant, sustained price movements. It is especially valuable for day traders and swing traders who need to understand both immediate and broader market trends. By offering a multi-timeframe perspective, the indicator helps traders make more nuanced and informed trading decisions.
Keep exploring
What we’ve verified
Access, alerts and repainting behaviour have not been independently verified for this indicator. Check the creator’s current publication and settings.
General descriptions and classifications are recovered research. Verified details above identify the specific checks we have completed. Check the creator’s current publication for later changes.


