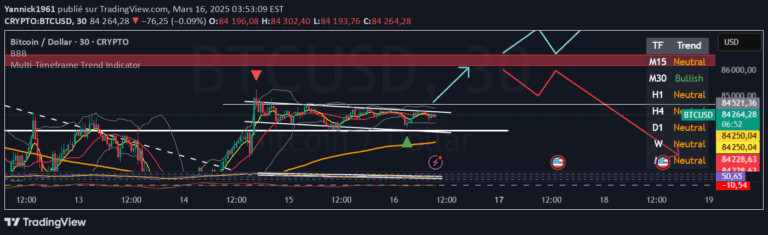
Green/Red Candle Probability (EMA 7, SMA 20, SMA 200)
A trading indicator that calculates probabilities of bullish and bearish candles using moving averages, helping traders understand market trends and potential price movements.
Explore 11,183 indicators. Filter beyond the obvious.
Discover the tools that fit the way you trade.
11,183 tools to explore
A trading indicator that calculates probabilities of bullish and bearish candles using moving averages, helping traders understand market trends and potential price movements.
A multi-timeframe trend indicator that analyzes market direction across five key timeframes using EMA and SMA crossovers for comprehensive trading insights.
Bollinger Bands signal tool that identifies extreme price movements and potential mean reversion opportunities by tracking price closes beyond standard deviation bands.
Likes, views, and comments are historical TradingView snapshots. They describe attention, not trading performance.