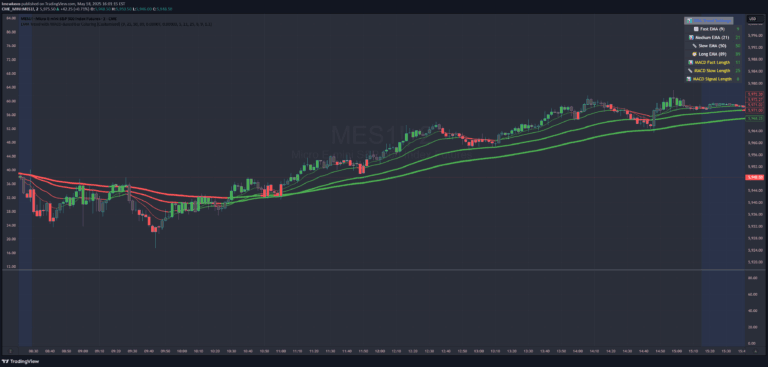
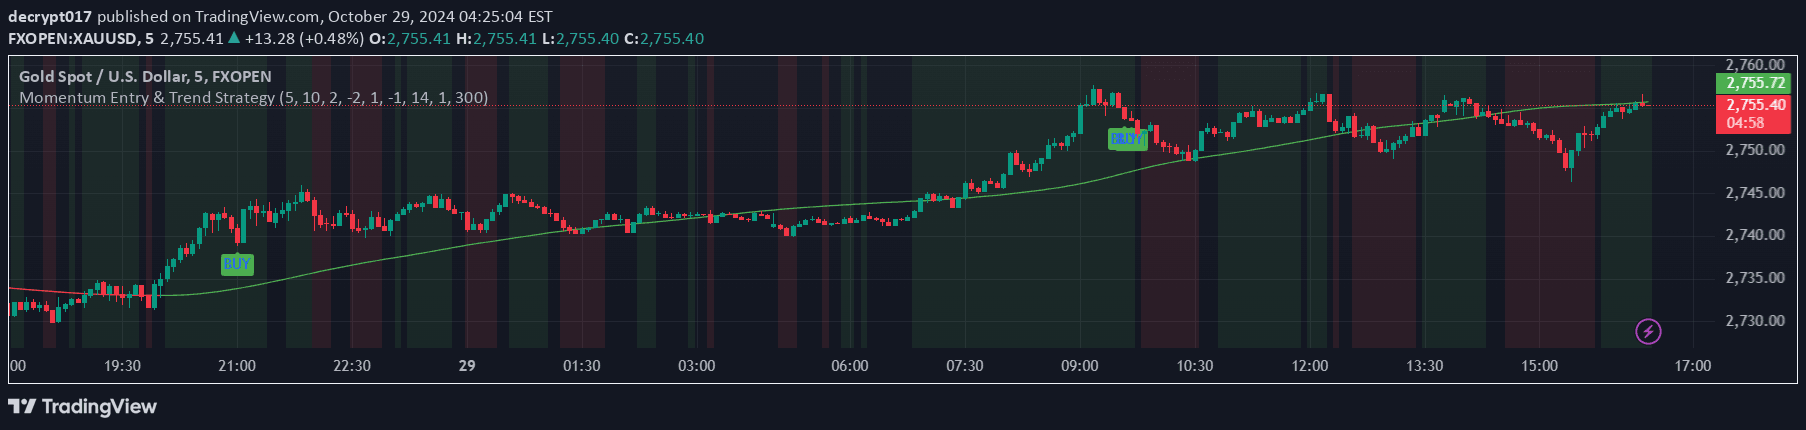
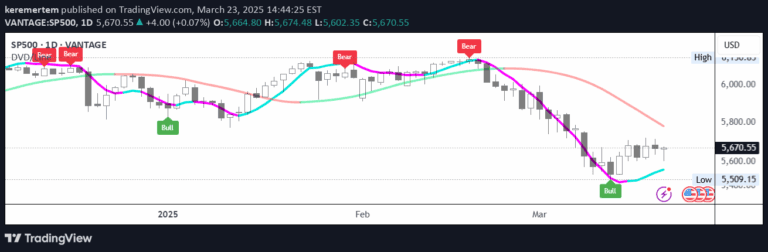
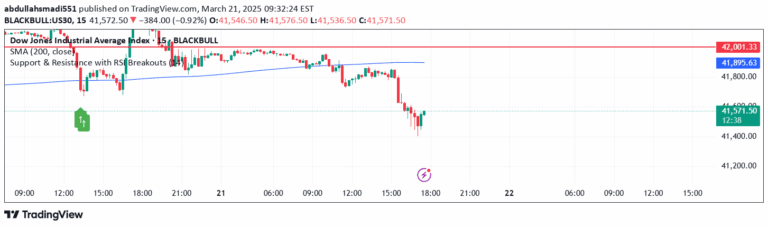
A trading indicator that identifies market trends using Exponential Moving Averages (EMAs), calculating trend strength and generating buy and sell signals based on price movement and technical analysis.
Explore complementary indicator rolesHow it works
The indicator calculates Exponential Moving Averages (EMAs) across multiple time periods, tracking the degree of change in closing prices relative to these EMAs. It analyzes the percentage differences between current prices and different EMA lengths to determine trend direction and strength. By comparing these calculated values, the script identifies potential uptrends and downtrends based on systematic comparisons.
Additionally, the script incorporates Relative Strength Index (RSI) calculations to supplement trend identification. It generates buy and sell signals by examining specific conditions such as price positioning relative to EMAs, trend direction, and previous price movements. The indicator uses visual elements like plotshape to mark these signals and dynamically changes background colors to represent detected market trends.
Why it may be useful
This trading indicator provides traders with a systematic approach to identifying market trends and potential entry and exit points. By combining multiple technical analysis tools like EMAs and RSI, it offers a comprehensive view of market dynamics that can help traders make more informed decisions. The visual representation of trends and signals allows for quick interpretation of complex market movements.
The script's multi-dimensional analysis reduces reliance on single indicators, providing a more robust framework for understanding market behavior. Its ability to generate clear buy and sell signals across different timeframes makes it versatile for various trading styles, from scalping to swing trading.
When to explore it
The indicator is most effective in markets with clear trending characteristics, where price movements show consistent directional momentum. It performs best in liquid markets with sufficient price volatility, such as major forex pairs, stock indices, and actively traded commodities. Traders should use this indicator in conjunction with other analytical tools to confirm signals and reduce false positives.
While the indicator can be applied across multiple timeframes, it is particularly useful for short to medium-term trading strategies. Traders should be cautious during periods of market consolidation or low volatility, where trend signals might be less reliable. Combining this indicator with fundamental analysis and risk management strategies can enhance its effectiveness in real-world trading scenarios.
Keep exploring
What we’ve verified
Access, alerts and repainting behaviour have not been independently verified for this indicator. Check the creator’s current publication and settings.
General descriptions and classifications are recovered research. Verified details above identify the specific checks we have completed. Check the creator’s current publication for later changes.