
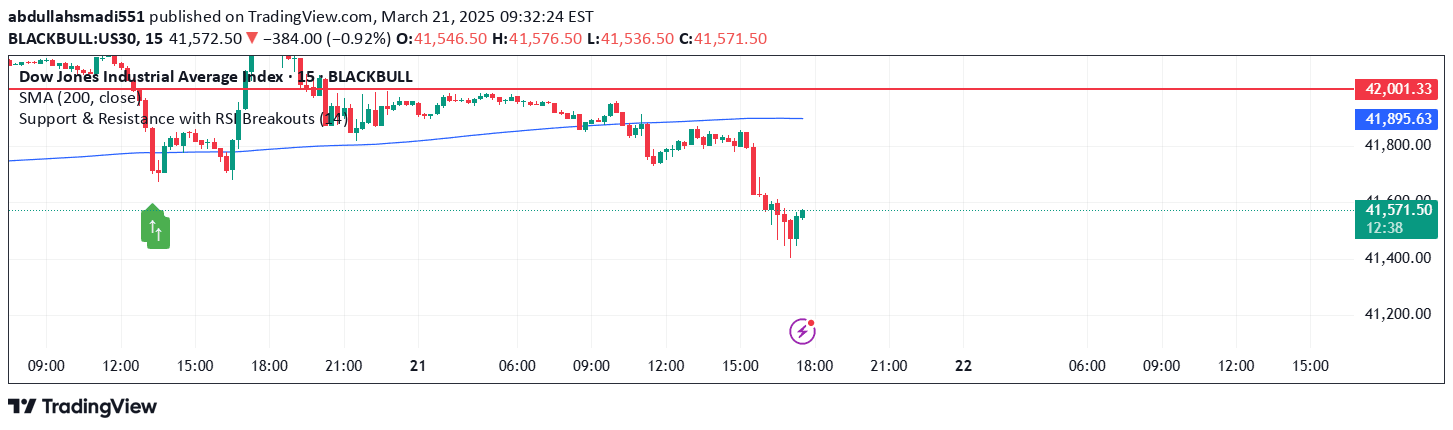
A TradingView Pine Script indicator using RSI to identify oversold and overbought market conditions, generating buy and sell signals based on specific RSI thresholds.
Explore complementary indicator rolesHow it works
The script calculates the 14-period RSI using closing prices, tracking price momentum across trading periods. When RSI drops below 20, it generates a buy signal, indicating potential oversold market conditions. Conversely, when RSI rises above 80, it triggers a sell signal, suggesting overbought market conditions.
The indicator visually marks these signals with green upward arrows for buy opportunities and red downward arrows for sell opportunities. Traders can customize the RSI period through input settings to suit their specific trading strategy and market analysis
Why it may be useful
RSI signals help traders identify potential market reversals and momentum shifts before they occur. By highlighting oversold and overbought conditions, the indicator provides early warning signs of possible price corrections.
These signals can help traders make more informed entry and exit decisions, reducing emotional trading and improving risk management. The visual arrow markers make it easy to quickly spot trading opportunities across different financial instruments and timeframes
When to explore it
This RSI breakout indicator works best in trending and range-bound markets with clear momentum patterns. It is most effective when combined with other technical analysis tools like support/resistance levels, moving averages, or trend confirmation indicators.
Traders should use additional confirmation signals to validate RSI-based trades and avoid false signals. The indicator is particularly useful for swing traders and day traders looking to capture short to medium-term price movements
Keep exploring
What we’ve verified
Access, alerts and repainting behaviour have not been independently verified for this indicator. Check the creator’s current publication and settings.
General descriptions and classifications are recovered research. Verified details above identify the specific checks we have completed. Check the creator’s current publication for later changes.



