Market Structure Break & Order Block by EmreKb
A market structure break and order block indicator that identifies trend reversals by analyzing price action breakouts and key candle formations to signal potential trading opportunities.
Explore 11,183 indicators. Filter beyond the obvious.
Discover the tools that fit the way you trade.
11,183 tools to explore
A market structure break and order block indicator that identifies trend reversals by analyzing price action breakouts and key candle formations to signal potential trading opportunities.
Breakout Probability indicator calculates the likelihood of new market highs or lows by analyzing historical price action and displaying percentage probabilities for potential price levels.
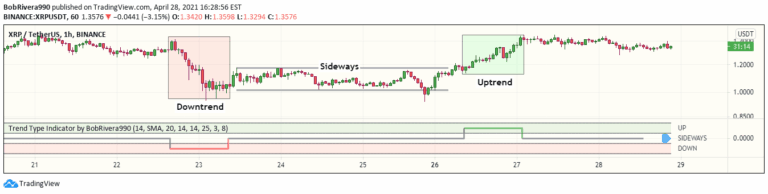
A technical analysis signal that uses ATR and ADX to detect market trends, distinguishing between uptrend, downtrend, and sideways movements by analyzing price volatility and directional momentum.
A trading indicator tracking institutional investor actions by calculating probabilities of market structure changes and order flow direction for strategic trading decisions.
Smart Money Concept (SMC) tracks institutional investor movements, identifying key market structure changes, order blocks, and liquidity zones to reveal potential trading opportunities.
Global Liquidity Index tracks worldwide central bank balance sheets, providing a comprehensive view of global monetary conditions and potential market trends through consolidated financial data.
Global Monetary Supply M2 tracks the monetary volume of the world's richest and most populous countries, measuring currency liquidity in USD.
A tool that identifies potential price reversal zones using statistical probability by analyzing historical swing points and calculating precise percentile-based predictions.
A comprehensive divergence analysis tool that calculates divergence strength across multiple indicators, providing a single metric to assess potential market reversals and trend shifts.
An advanced MACD variant that normalizes momentum measurements and uses Heikin-Ashi candles to provide smoother trend analysis across different assets and timeframes.
A Smart Money Concepts trading indicator that identifies demand and supply zones, highlighting key liquidity levels and price structure changes across multiple timeframes.
A multi-asset performance indicator that tracks percentage changes across 30 symbols, offering comprehensive insights into asset performance, correlation, and market dynamics.
Likes, views, and comments are historical TradingView snapshots. They describe attention, not trading performance.