
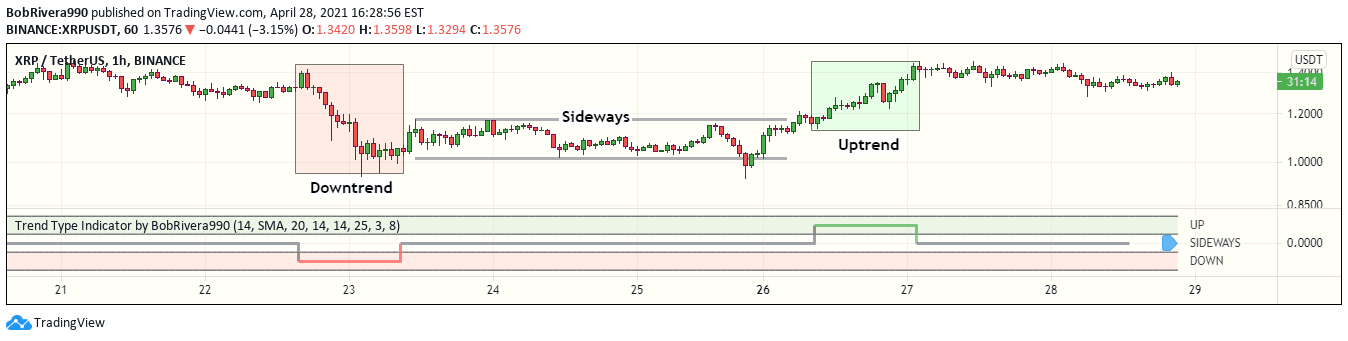
A technical analysis signal that uses ATR and ADX to detect market trends, distinguishing between uptrend, downtrend, and sideways movements by analyzing price volatility and directional momentum.
Explore complementary indicator rolesHow it works
The signal first checks for a sideways trend by analyzing the Average True Range (ATR) and Average Directional Index (ADX). If ATR is below its 20-period moving average and ADX is less than 25, the market is considered sideways.
For non-sideways trends, the signal uses Plus and Minus Directional Indicators (+DI & -DI) to determine trend direction. When +DI is higher than -DI, it indicates an uptrend, and when -DI is higher, it suggests a downtrend
Why it may be useful
This signal helps traders understand market dynamics by providing a systematic approach to trend identification. By using multiple technical indicators, it offers a more robust analysis of price movements.
Traders can use this information to make more informed decisions about entry and exit points. The multi-step approach reduces the likelihood of false trend signals and provides a comprehensive view of market momentum
When to explore it
The signal works best in markets with clear trending or consolidating characteristics. It is particularly useful for swing traders looking to confirm trend strength before entering positions. Traders should apply this signal across multiple timeframes to validate trend consistency.
It is most effective in liquid markets with sufficient trading volume. Avoid using the signal during highly unpredictable market events or during news releases that can cause sudden price volatility
Keep exploring
What we’ve verified
Access, alerts and repainting behaviour have not been independently verified for this indicator. Check the creator’s current publication and settings.
General descriptions and classifications are recovered research. Verified details above identify the specific checks we have completed. Check the creator’s current publication for later changes.


