ADX and DI
ADX measures trend strength and direction by analyzing price movement. It helps traders identify the presence and power of a trend, indicating whether a market is trending or ranging.
Explore 11,183 indicators. Filter beyond the obvious.
Discover the tools that fit the way you trade.
11,183 tools to explore
ADX measures trend strength and direction by analyzing price movement. It helps traders identify the presence and power of a trend, indicating whether a market is trending or ranging.
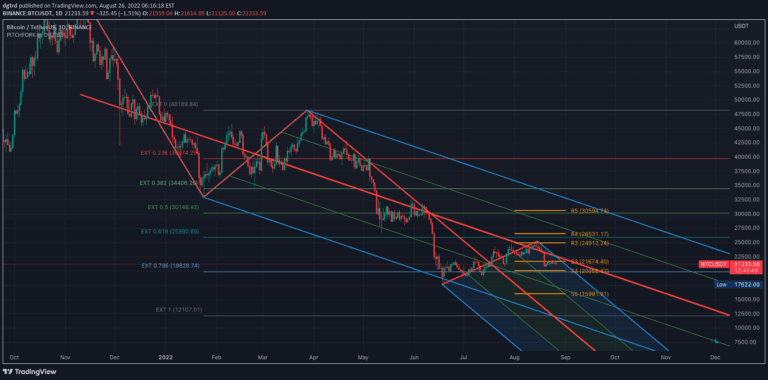
Pitchfork is a technical indicator that helps traders identify potential support and resistance levels by drawing trend lines based on three strategic points in price movement.
A versatile divergence indicator that identifies potential trend reversals by comparing price action with an oscillator's momentum, adaptable to multiple technical indicators.
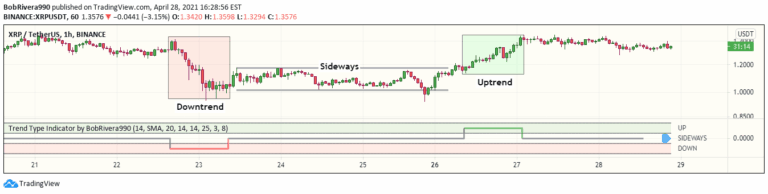
A technical analysis signal that uses ATR and ADX to detect market trends, distinguishing between uptrend, downtrend, and sideways movements by analyzing price volatility and directional momentum.
A dynamic range detection indicator that identifies price consolidation zones, highlights range extremities, and signals potential breakouts using real-time color-coded markers.
A trading screener that identifies potential overbought or oversold market conditions across multiple symbols using a Mean Reversion Channel. Helps traders quickly scan assets for trading opportunities.
Follow Line is a trend-following indicator that tracks price movements relative to Bollinger Bands, generating buy and sell signals based on price volatility and directional changes.
A derivative RSI indicator using a Moving Average with a trailing stop level that generates buy and sell signals based on crossovers and market conditions.
Flag Finder is a technical analysis tool that identifies bullish and bearish flag patterns, helping traders detect potential price continuation signals during market trends.
A dynamic trend indicator that fits regression lines at different intervals, revealing market trends and potential price channels by calculating linear trends across specified timeframes.
The Relative Trend Index (RTI) is an advanced technical indicator that measures trend strength by analyzing price positioning within its recent range, offering more adaptive insights than traditional momentum tools.
Multi-timeframe market formation tool that analyzes up to 6 different timeframes simultaneously, revealing market structure, support/resistance levels, and synchronization across time periods.
Likes, views, and comments are historical TradingView snapshots. They describe attention, not trading performance.