
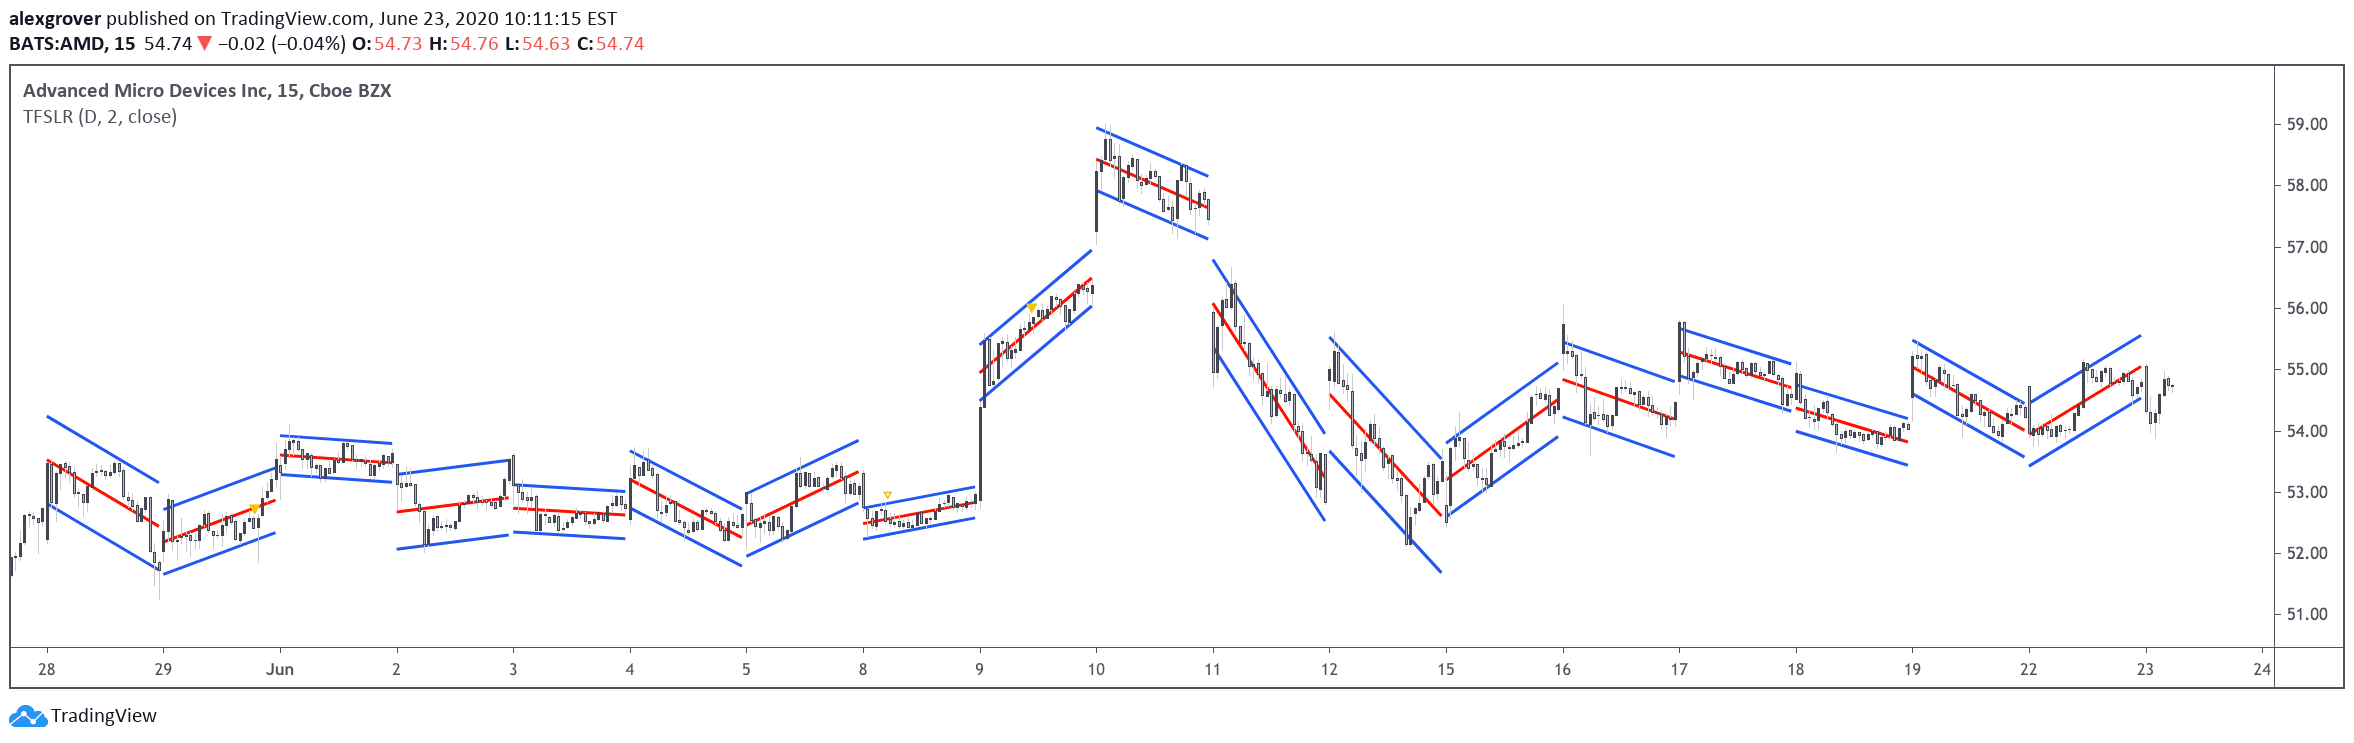
A dynamic trend indicator that fits regression lines at different intervals, revealing market trends and potential price channels by calculating linear trends across specified timeframes.
Explore complementary indicator rolesHow it works
The indicator uses linear regression to fit a trend line at user-defined intervals, calculating the line's slope and spread. By selecting a specific timeframe like daily or weekly, it creates a channel representing price movement. The channel's width is determined by a multiplication factor applied to the root mean square error (RMSE).
A steeper line indicates a stronger trend, while a wider channel suggests more price variations. The indicator uses a combination of weighted moving average (WMA) and simple moving average (SMA) to determine precise regression line start and end points
Why it may be useful
This trend analysis tool helps traders understand market dynamics by providing visual insights into price movement and trend strength. By revealing the underlying linear trend across different intervals, traders can identify potential trend directions, momentum, and market volatility.
The channel's width offers insights into price retracements and trend stability. Comparing the slope and channel width allows traders to distinguish between strong, clean trends and more chaotic market conditions, enabling more informed trading decisions
When to explore it
The indicator works best in markets with clear directional movements and sufficient historical data. It is particularly useful for swing traders analyzing medium-term trends across daily or weekly timeframes. Traders should use this tool when seeking to understand trend strength, potential price channels, and market volatility.
It is most effective in markets with consistent price movements and less useful in highly erratic or sideways markets. Combining this indicator with other technical analysis tools can provide more comprehensive market insights
Keep exploring
What we’ve verified
Access, alerts and repainting behaviour have not been independently verified for this indicator. Check the creator’s current publication and settings.
General descriptions and classifications are recovered research. Verified details above identify the specific checks we have completed. Check the creator’s current publication for later changes.



