TF Segmented Linear Regression
A dynamic trend indicator that fits regression lines at different intervals, revealing market trends and potential price channels by calculating linear trends across specified timeframes.
Explore 11,183 indicators. Filter beyond the obvious.
Discover the tools that fit the way you trade.
11,183 tools to explore
A dynamic trend indicator that fits regression lines at different intervals, revealing market trends and potential price channels by calculating linear trends across specified timeframes.
Time Segmented Volume is a leading indicator that measures money flow in and out of a financial instrument by analyzing price and volume segments to predict potential trend directions.
A custom trading indicator that identifies average price movements across different trading periods, using time-based averages to create dynamic support and resistance lines.
A custom speedometer visualization tool that converts complex market data like analyst recommendations and put-call ratios into an intuitive graphical representation of market sentiment and trend.
A specialized trading signal that tracks 90-minute market cycles across three distinct time segments during the morning trading hours in New York.
An adaptive volume-based indicator using Kalman Filter that creates dynamic price bands to identify market states and potential trend reversals across different market conditions.
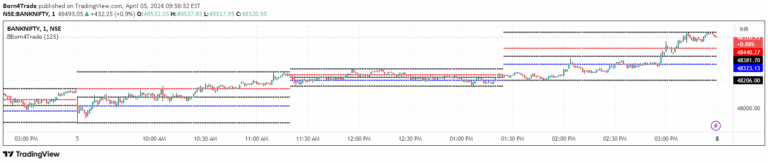
Born4Trade analyzes intraday price ranges by dividing high and low points into segments, creating strategic trading reference points for market entry and exit.
A normalized Average True Range (ATR) indicator that uses color-coded columns to represent different volatility levels, helping traders identify market conditions and potential trading strategies.
A clean indicator that draws horizontal lines at key period opening prices, helping traders identify and track institutional levels across different timeframes.
A comprehensive market activity indicator tracking bullish and bearish bar counts across different daily sessions, providing visual and numerical insights into market performance.
A trading signal that divides the trading session into two distinct time periods for strategic market participation and timing of trades based on different market characteristics.
A systematic approach dividing trading day into four quarters, each representing unique market behaviors and potential trading opportunities based on time-specific characteristics.
Likes, views, and comments are historical TradingView snapshots. They describe attention, not trading performance.