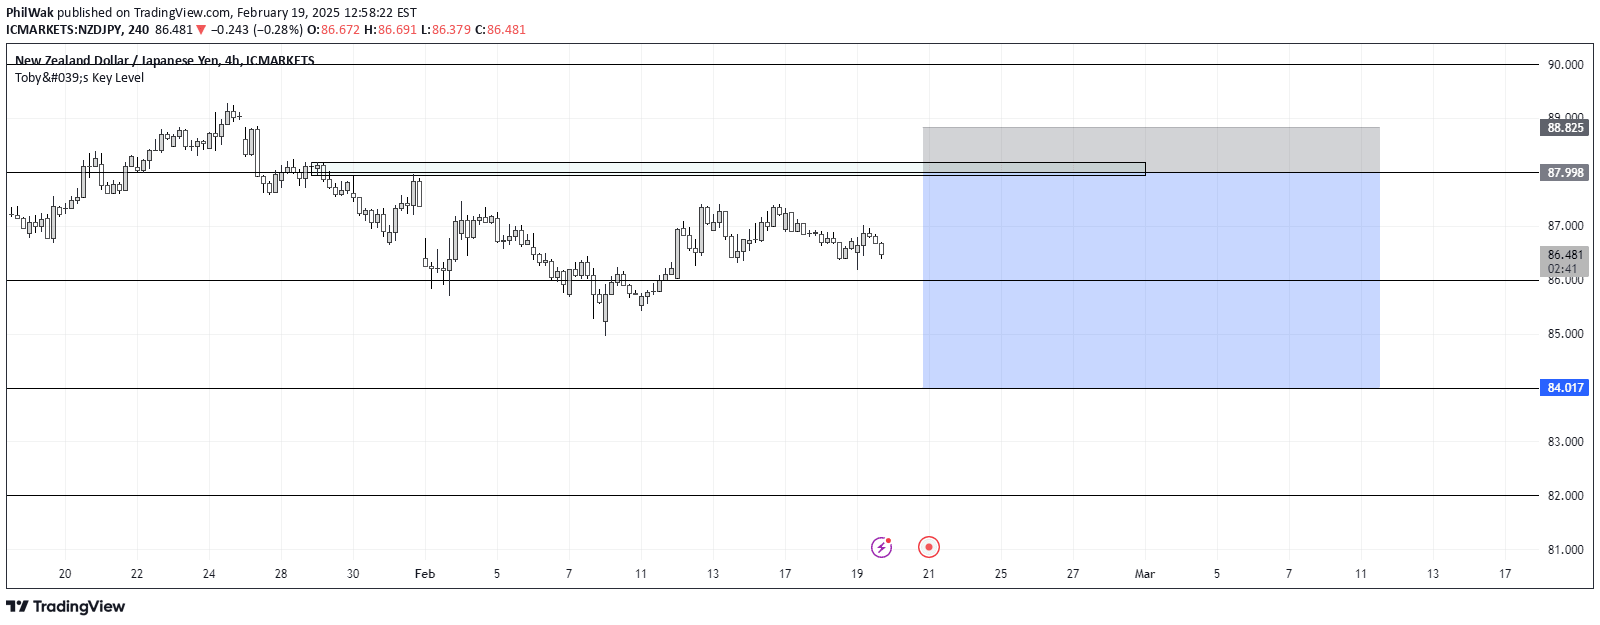
A clean indicator that draws horizontal lines at key period opening prices, helping traders identify and track institutional levels across different timeframes.
Explore complementary indicator rolesHow it works
The indicator automatically identifies and plots horizontal lines at the opening prices for multiple time periods including Year, Quarter, Month, Week, and Day. Each line is precisely calculated and segmented to span only its original time period, ensuring clean and accurate representation of opening levels.
The lines are dynamically generated based on the chart's current timeframe and session settings, providing traders with a flexible tool that adapts to different trading environments and chart configurations.
Why it may be useful
These horizontal open lines serve as critical reference points for understanding institutional and market sentiment across different timeframes. By visualizing key opening prices, traders can quickly identify potential support, resistance, and psychological levels that might influence price movement.
The indicator helps traders make more informed decisions by providing a clear, uncluttered view of significant price levels, allowing for better strategic planning and risk management.
When to explore it
This indicator is most effective when analyzing markets with clear directional movements and during periods of potential trend confirmation or reversal. Traders can use these lines to validate entry and exit points, assess market structure, and understand price behavior relative to key opening levels.
It is particularly useful in volatile markets where understanding institutional levels can provide a competitive edge, helping traders align their strategies with broader market dynamics and potential turning points.
Keep exploring
What we’ve verified
Access, alerts and repainting behaviour have not been independently verified for this indicator. Check the creator’s current publication and settings.
General descriptions and classifications are recovered research. Verified details above identify the specific checks we have completed. Check the creator’s current publication for later changes.