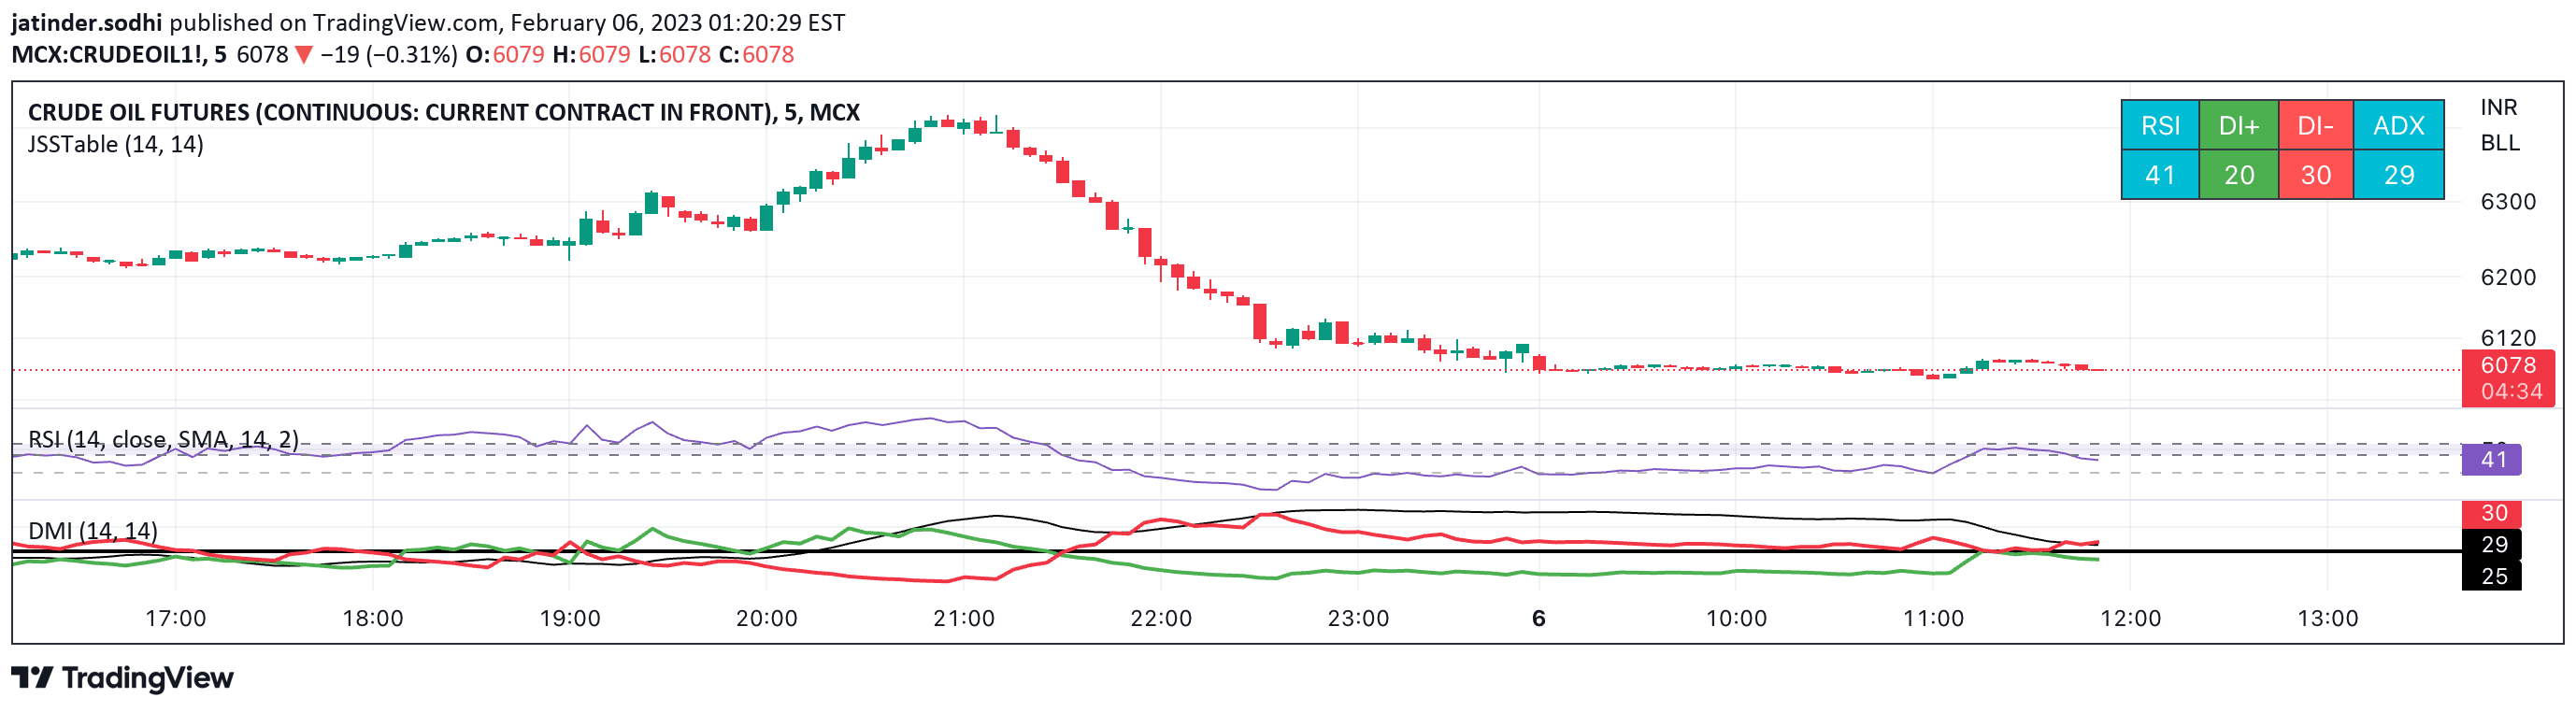
ADX measures trend strength and direction by analyzing price movement. It helps traders identify the presence and power of a trend, indicating whether a market is trending or ranging.
Explore complementary indicator rolesHow it works
The Average Directional Index (ADX) calculates trend strength through directional movement indicators. It uses positive and negative directional movement lines (+DI and -DI) to assess trend momentum. The ADX line ranges from 0 to 100, with readings above 25 indicating a strong trend.
When +DI crosses above -DI, it suggests a potential bullish trend. Conversely, when -DI crosses above +DI, it indicates a potential bearish trend. Traders use these crossovers and ADX line values to determine trend intensity and potential trade opportunities
Why it may be useful
ADX provides crucial insights into market trends by quantifying trend strength objectively. It helps traders distinguish between trending and ranging markets, reducing false signal risks. The indicator enables more informed trading decisions by revealing momentum and potential trend reversals.
Traders can use ADX to filter out weak trends and focus on high-probability trading opportunities. It complements other technical analysis tools by offering a unique perspective on market dynamics. ADX helps minimize emotional trading and promotes a more systematic approach to market analysis
When to explore it
ADX works best in markets with clear directional movements, such as stocks, commodities, and forex. It is most effective during strong trending periods, helping traders identify and confirm trend strength. Traders should use ADX in conjunction with other technical indicators for comprehensive analysis.
It is particularly useful in markets experiencing sustained momentum in either direction. ADX is less reliable in choppy or sideways markets with low directional movement. Combining ADX with trend-following strategies can enhance trading precision and risk management
Keep exploring
What we’ve verified
Reviewed 2026-10-20 · Published Pine v4 source; publication updated 28 January 2021
- Access
- Free, open-source publicationSource checked
TradingView labels this publication open-source and makes its Pine code available.
- Alerts
- No dedicated script alert conditionsSource checked
The 32-line source plots ADX, DI+ and DI−, with no alert() or alertcondition() calls. This does not rule out TradingView’s standard plot-based alerts.
- Repainting & timing
- Current-bar values can changeSource checked
Calculations use the current candle’s high and low plus historical prices. No future-data request or backward plot offset appears in this source. Closed-bar stability has not been tested in replay.
Publication and source review only. No live-trading, replay or profitability test was performed.
Review the creator’s publication ↗General descriptions and classifications are recovered research. Verified details above identify the specific checks we have completed. Check the creator’s current publication for later changes.