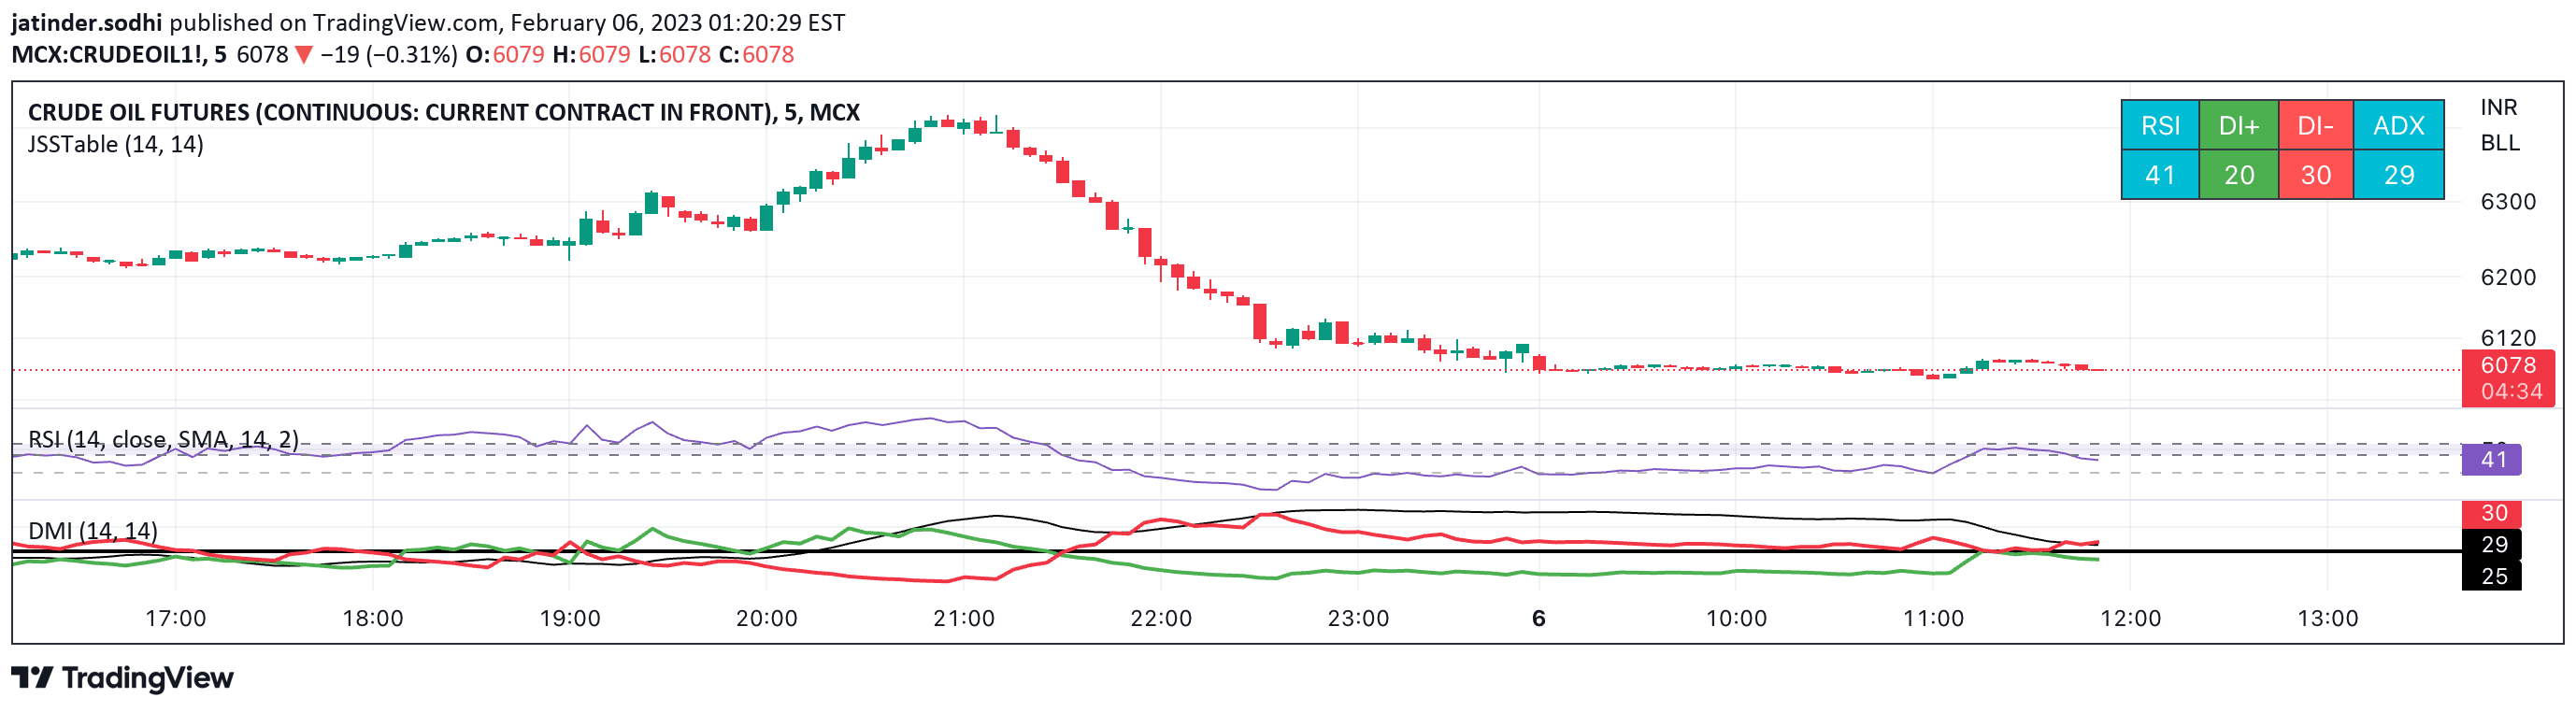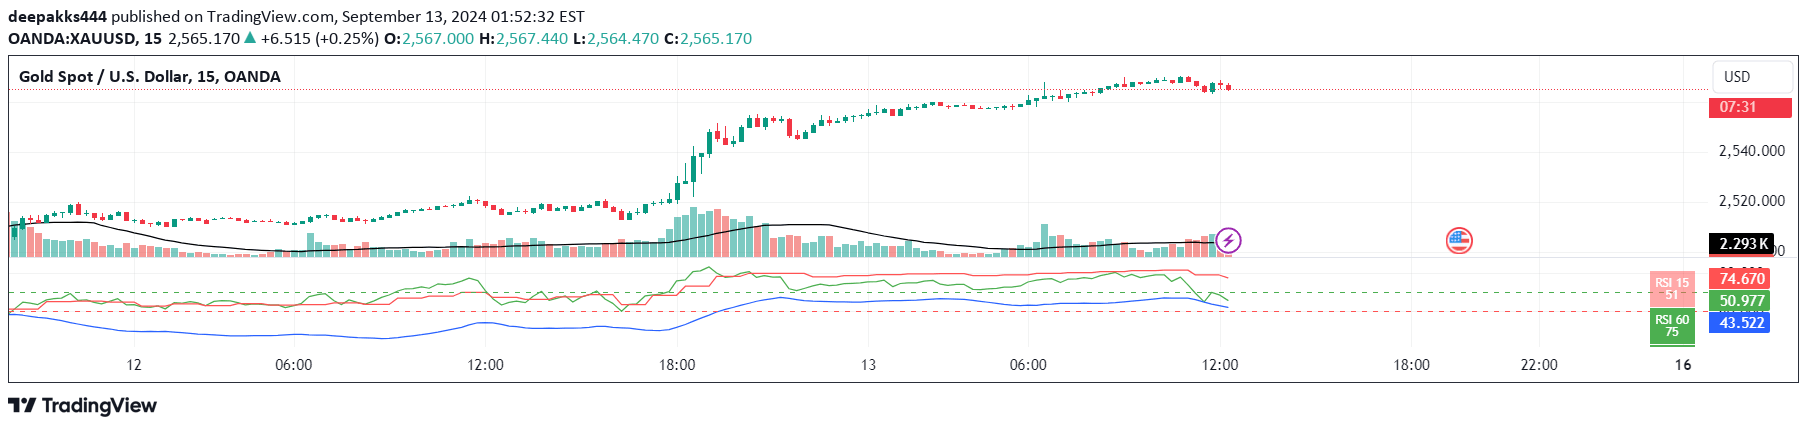
A trading strategy using RSI on multiple timeframes and ADX to identify strong market momentum and trend strength for potential buy and sell signals.
Explore complementary indicator rolesHow it works
The signal uses Relative Strength Index (RSI) values from 15-minute and hourly timeframes to assess market momentum. By comparing RSI levels across these different periods, traders can identify potential buying or selling opportunities when specific thresholds are crossed.
Additionally, the Average Directional Index (ADX) is used to confirm the trend strength. When ADX is above 25, it indicates a strong trend, which adds reliability to the RSI-generated signals. This multi-layered approach helps filter out weak or choppy market conditions and focuses on moments of clear market movement.
Why it may be useful
This signal provides traders with a comprehensive approach to market analysis by combining momentum indicators with trend strength confirmation. By using multiple timeframes and an additional trend indicator, traders can make more informed decisions with increased confidence in their trade entries and exits.
The methodology reduces the risk of false signals by requiring confirmation across different time horizons and ensuring that trades are executed during periods of genuine market momentum. This approach helps traders avoid potential traps in sideways or uncertain market conditions.
When to explore it
The signal is most effective in markets with clear directional movements and strong trends. It works best in volatile markets where momentum can be quickly identified and confirmed across multiple timeframes. Traders should pay particular attention to this strategy during periods of significant market activity.
The signal is especially useful for short-term trading styles like scalping and day trading, where quick identification of momentum shifts is crucial. It is less suitable for long-term swing trading, where more complex trend analysis might be required.
Keep exploring
What we’ve verified
Access, alerts and repainting behaviour have not been independently verified for this indicator. Check the creator’s current publication and settings.
General descriptions and classifications are recovered research. Verified details above identify the specific checks we have completed. Check the creator’s current publication for later changes.