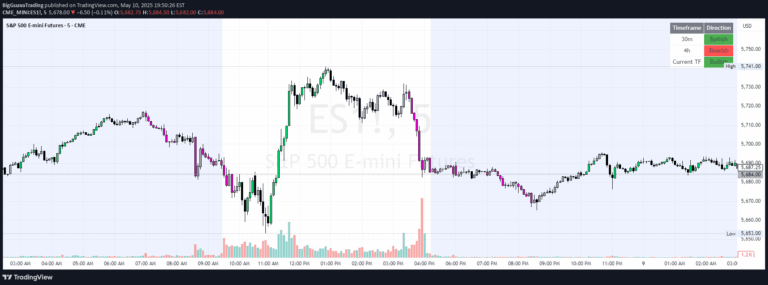
A multi-timeframe trend analysis tool using exponential moving averages with color-coded clouds, ADX filtering, and dynamic alignment indicators for comprehensive market trend assessment.
Explore complementary indicator rolesHow it works
The indicator calculates multiple exponential moving averages (10, 20, 50, and 200 periods) using closing prices. It creates two color-coded EMA clouds: one between 10 and 20 EMAs, and another between 20 and 50 EMAs.
Colors change based on EMA relationships, indicating bullish or bearish momentum. An optional ADX filter helps identify trending versus ranging markets by assessing market conditions and turning clouds grey during potentially choppy periods
Why it may be useful
This indicator provides traders with a comprehensive visual representation of market trends across different timeframes. By integrating multiple moving averages and an ADX filter, it offers insights into trend strength, direction, and potential market regime changes.
The color-coded clouds make it easy to quickly assess market momentum, while the configurable alerts help traders identify high-probability trading opportunities
When to explore it
The indicator works best in markets with clear trending characteristics, particularly in liquid and moderately volatile instruments. It is most effective when used across daily, 4-hour, and 1-hour charts for swing and day trading strategies.
Traders should pay special attention to moments of full trend alignment, EMA crossovers, and confluence conditions while being cautious during periods of low ADX values indicating potential range-bound markets
Keep exploring
What we’ve verified
Access, alerts and repainting behaviour have not been independently verified for this indicator. Check the creator’s current publication and settings.
General descriptions and classifications are recovered research. Verified details above identify the specific checks we have completed. Check the creator’s current publication for later changes.