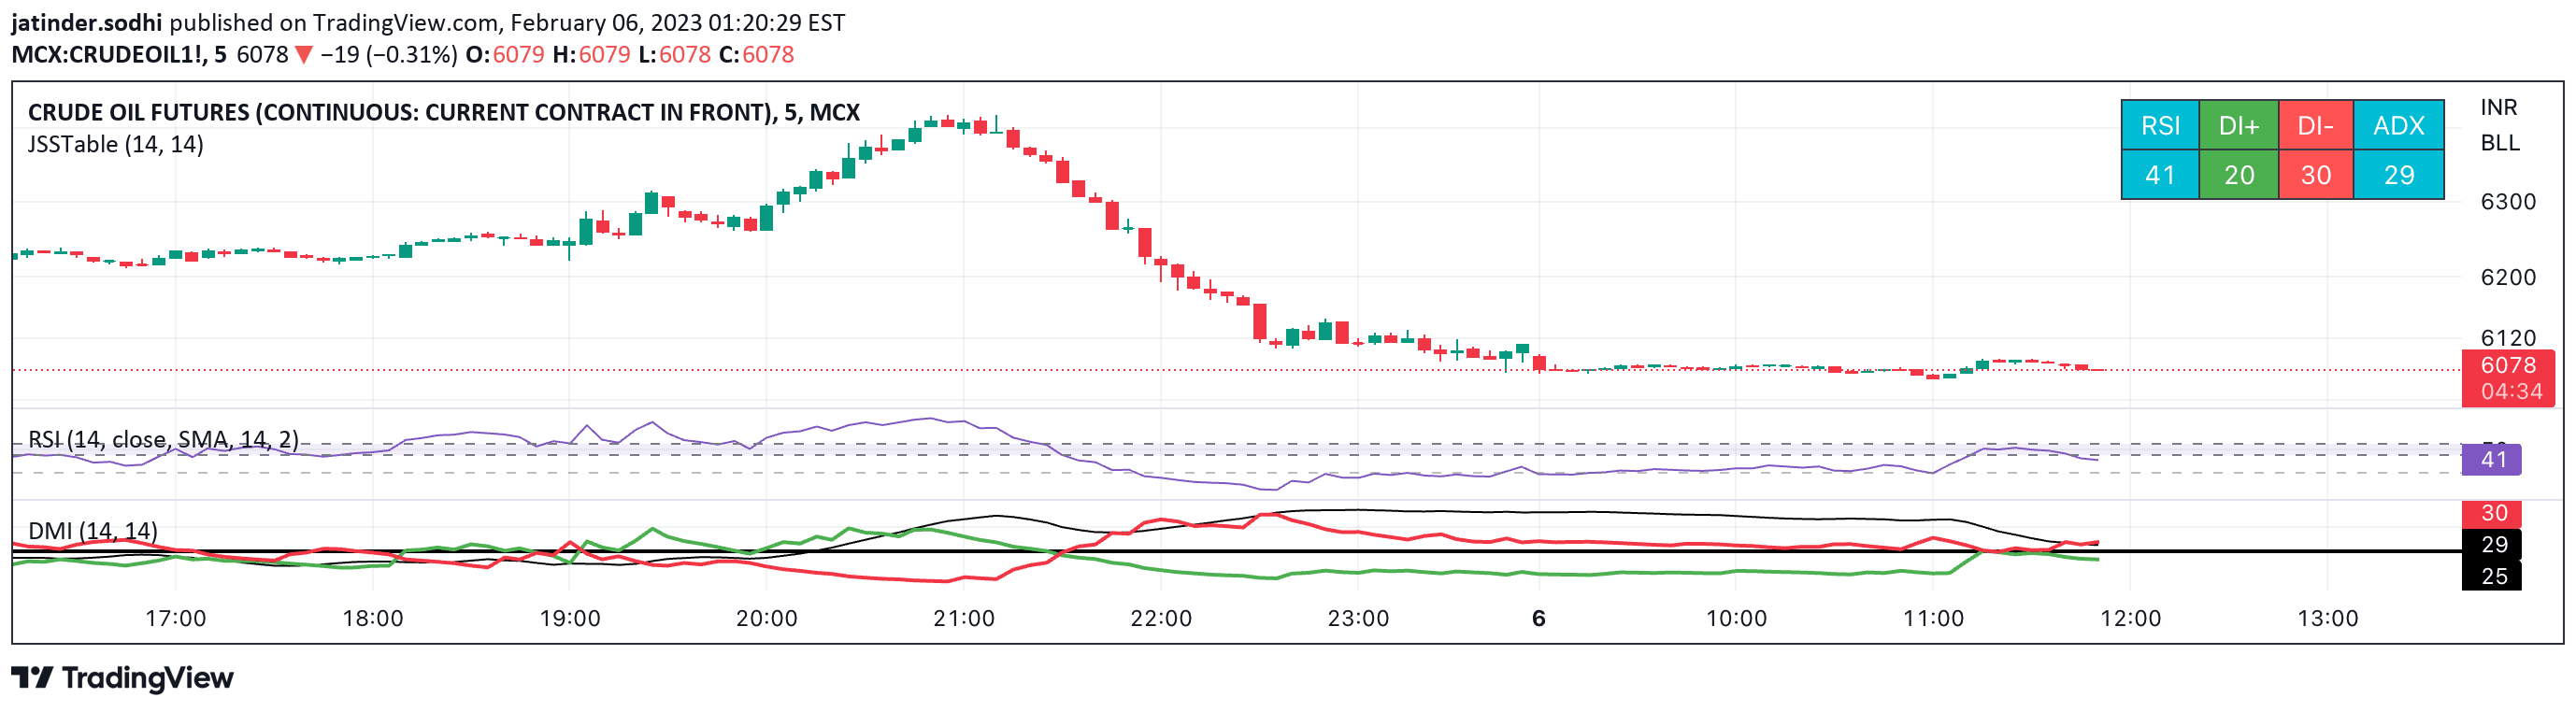
Point and Shoot is a dynamic trading indicator that combines RSI analysis, pivot point detection, and trend line drawing to identify potential market movements and turning points.
Explore complementary indicator rolesHow it works
The Point and Shoot indicator operates by calculating a custom RSI using relative moving averages and tracking pivot points on the price chart. It identifies potential trend lines by connecting significant high and low points, dynamically plotting lines that represent market direction and momentum.
The script uses advanced filtering techniques to validate trend lines, checking whether subsequent price action respects or breaks these lines. It also incorporates a weighted moving average (WMA) to provide additional context, coloring the RSI line based on its relationship to the WMA and offering visual cues about potential trend changes.
Why it may be useful
This indicator provides traders with a comprehensive visual tool for understanding market dynamics, combining multiple analytical techniques into a single, powerful framework. By integrating RSI, pivot points, and trend line analysis, it offers a more nuanced view of potential price movements than traditional single-metric indicators.
The script's ability to dynamically draw and validate trend lines helps traders identify potential support and resistance levels, trend strengths, and possible reversal points. Its multi-layered approach allows traders to make more informed decisions by considering momentum, trend direction, and key price levels simultaneously.
When to explore it
The Point and Shoot indicator is most effective in markets with clear trending characteristics, where price action shows consistent directional movement. It works particularly well in volatile markets where rapid identification of trend changes can provide significant trading opportunities.
Traders should apply this indicator in timeframes ranging from short-term (minutes) to medium-term (hours), with particular effectiveness in forex, stock, and cryptocurrency markets. It is especially useful during periods of market volatility, when traditional trend-following methods might struggle to provide clear signals.
Keep exploring
What we’ve verified
Access, alerts and repainting behaviour have not been independently verified for this indicator. Check the creator’s current publication and settings.
General descriptions and classifications are recovered research. Verified details above identify the specific checks we have completed. Check the creator’s current publication for later changes.