YOUR INDICATOR RESEARCH STARTS HERE

Find the right indicator.
Understand what it does.

Explore 11,183 indicators. Filter beyond the obvious.
Discover the tools that fit the way you trade.

THE INDICATOR LIBRARY

Results for “consolidation”

11,183 tools to explore

928 indicators matching your filters
Save search
TrendMomentumEditor’s pick

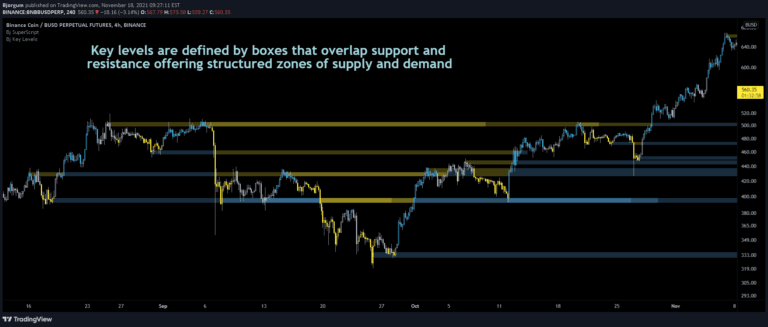
Bjorgum Key Levels

by Bjorgum

Key Levels strategy identifies critical price action points like breakouts, false breakouts, and backchecks to help traders understand market movement and potential trading opportunities.

Main price chart · unverifiedDay Trading · Swing Trading
Explore
19.2Klikes505.6Kviews542comments
Save
TrendVolatilityEditor’s pick

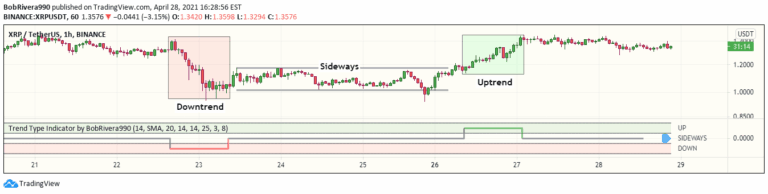
Trend Type Indicator by BobRivera990

by BobRivera990

A technical analysis signal that uses ATR and ADX to detect market trends, distinguishing between uptrend, downtrend, and sideways movements by analyzing price volatility and directional momentum.

Separate pane · unverifiedSwing Trading
Explore
10.3Klikes285.2Kviews136comments
Save
LevelsSignalVolume

Money Flow Profile [LuxAlgo]

by LuxAlgo

A charting tool that measures traded volume and money flow across price levels, revealing trading activity, sentiment, and key market levels for strategic analysis.

Main price chart · unverifiedScalping · Day Trading
Explore
9.6Klikes216.8Kviews43comments
Save
LevelsSignalVolatility

Range Detector [LuxAlgo]

by LuxAlgo

A dynamic range detection indicator that identifies price consolidation zones, highlights range extremities, and signals potential breakouts using real-time color-coded markers.

Main price chart · unverifiedScalping · Day Trading
Explore
9.4Klikes237Kviews62comments
Save
TrendEditor’s pick

Cup Finder

by LonesomeTheBlue

A technical analysis script that identifies cup-like price formations by creating channels and tracking potential breakout points in financial markets using specific bar search and channel width parameters.

Main price chart · unverifiedSwing Trading
Explore
9.1Klikes127Kviews90comments
Save
TrendEditor’s pick

[SK] Fibonacci Auto Trend Scouter

by sirkriz

FATS is an advanced trading indicator that automatically draws trend lines, Fibonacci levels, and trend sights across multiple timeframes to help traders identify market direction and potential support/resistance zones.

Main price chart · unverifiedDay Trading · Swing Trading
Explore
8.5Klikes249.7Kviews153comments
Save
TrendVolatilityEditor’s pick

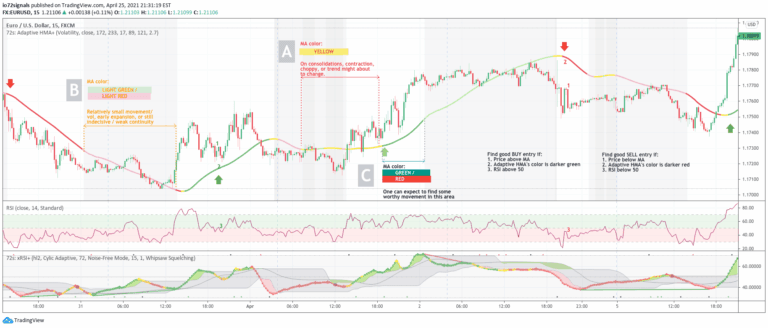
72s: Adaptive Hull Moving Average+

by io72signals

An adaptive Hull Moving Average that dynamically adjusts its period based on volume and volatility, providing clearer trend signals and market condition insights for traders.

Main price chart · unverifiedDay Trading · Swing Trading
Explore
8.2Klikes154.6Kviews137comments
Save
PatternsSignalTrend

2B Reversal Pattern (Expo)

by Zeiierman

The 2B reversal pattern identifies potential market trend reversals by detecting false breakouts and price rebounds, signaling opportune entry points for traders.

Main price chart · unverifiedScalping · Day Trading
Explore
7.3Klikes147.6Kviews60comments
Save
LevelsSignal

Swing Levels and Liquidity - By Leviathan

by LeviathanCapital

An advanced script that identifies and visualizes pivot points, helping traders recognize market structure, potential support/resistance levels, and trading opportunities through customizable swing high and low indicators.

Main price chart · unverifiedScalping · Day Trading
Explore
7.3Klikes202.2Kviews118comments
Save

Likes, views, and comments are historical TradingView snapshots. They describe attention, not trading performance.

START WITH A QUESTION

A little less searching.
A lot more understanding.

Tell DeepAlpha what you need. Get an explanation, a shortlist,
and a direct path to the indicators behind it.

Ask DeepAlpha