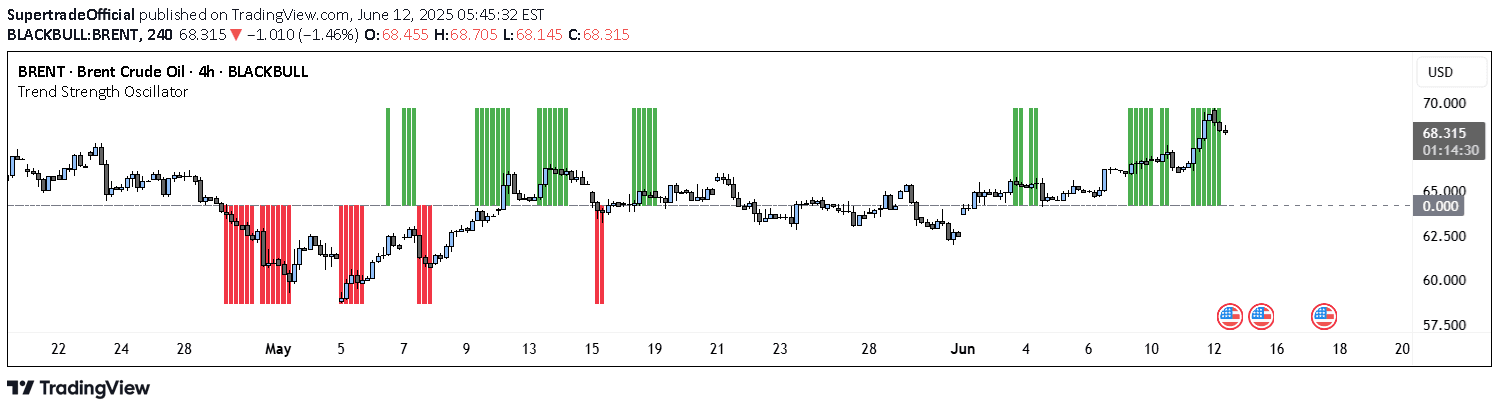
The 2B reversal pattern identifies potential market trend reversals by detecting false breakouts and price rebounds, signaling opportune entry points for traders.
Explore complementary indicator rolesHow it works
The 2B reversal pattern involves identifying a price movement that breaks through a support or resistance level, causing initial market momentum. Traders observe a sharp price move beyond the trading range, followed by a quick reversal back into the original range, creating a 'spring' effect.
This pattern occurs in both bullish and bearish markets, with the key characteristic being a false breakout that suggests underlying market strength opposite to the initial price movement. The reversal indicates potential exhaustion of the current trend and hints at an imminent directional change.
Why it may be useful
The 2B reversal pattern provides traders with a strategic method to identify potential trend reversals with reduced risk. By waiting for the price to 'spring back' to the initial breakout level, traders can minimize potential losses and enter the market with more confidence.
This pattern is particularly valuable because it offers insights into market psychology, revealing moments when selling or buying pressure suddenly diminishes. It helps traders understand market sentiment and potential shifts in momentum before they become widely apparent.
When to explore it
The 2B reversal pattern is most effective during periods of market consolidation or when an asset has been trading within a well-defined range. Traders should look for this pattern after extended trends, where market participants might be experiencing fatigue or uncertainty about the current price direction.
Ideal conditions include high-volume breakout attempts followed by quick reversals, which signal potential trend changes. Traders should combine this pattern with other technical indicators to confirm signals and enhance the probability of successful trades.
Keep exploring
What we’ve verified
Access, alerts and repainting behaviour have not been independently verified for this indicator. Check the creator’s current publication and settings.
General descriptions and classifications are recovered research. Verified details above identify the specific checks we have completed. Check the creator’s current publication for later changes.