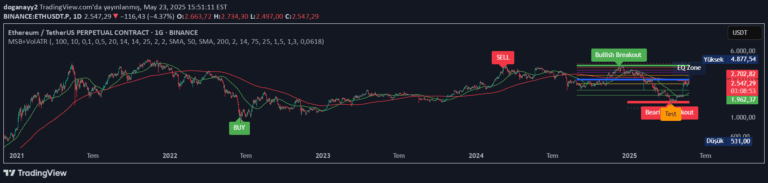
Market Structure Break & Order Block by EmreKb
A market structure break and order block indicator that identifies trend reversals by analyzing price action breakouts and key candle formations to signal potential trading opportunities.
Explore 11,183 indicators. Filter beyond the obvious.
Discover the tools that fit the way you trade.
11,183 tools to explore
A market structure break and order block indicator that identifies trend reversals by analyzing price action breakouts and key candle formations to signal potential trading opportunities.
A market structure analysis technique that identifies trend changes and pivotal points using Break of Structure (BOS) and Change of Character (CHOCH) concepts.
An algorithmic tool that generates target levels based on market structure shifts and breaks, helping traders identify potential take profit, entry, and reversal points.
Market structure analysis helps traders identify trend direction, break of structure (BOS), and change of character (CHOCH) to understand market movements and potential trend reversals.
A price action indicator that identifies key market levels using swing highs, lows, and volume analysis to highlight potential support, resistance, and market structure changes.
An advanced market structure indicator that identifies key price breaks, market structure shifts, and potential support/resistance zones using pivot points and customizable target calculations.
A multi-functional trading indicator that visualizes high timeframe liquidity levels, identifies market structure breaks, and highlights price displacements for advanced trading strategies.
A market structure indicator that tracks price zigzags, identifying trend changes and market structure breaks with color-coded visualization and adjustable parameters.
A market structure indicator that detects swing highs and lows to help traders identify potential trend changes and key market levels across different trading conditions.
A multi-faceted trading indicator that identifies market structure breakouts using volume, ATR, and RSI to validate potential trend changes and entry points across different markets.
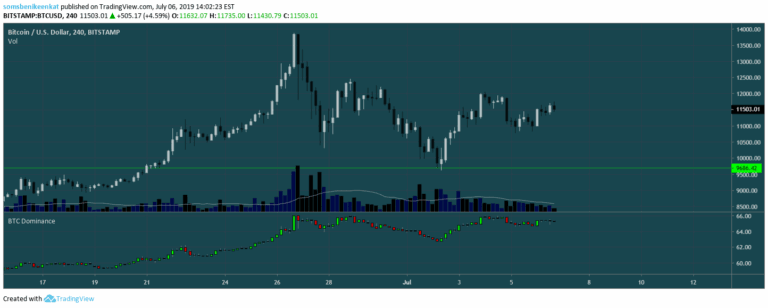
A custom script for plotting BTC Dominance chart in a separate indicator window, providing traders with an easy-to-access visual representation of Bitcoin's market share.
A dynamic trading indicator combining 1-hour trailing stop, multi-timeframe Fibonacci levels, and ZigZag structure detection to identify trend direction and potential reversal zones.
Likes, views, and comments are historical TradingView snapshots. They describe attention, not trading performance.