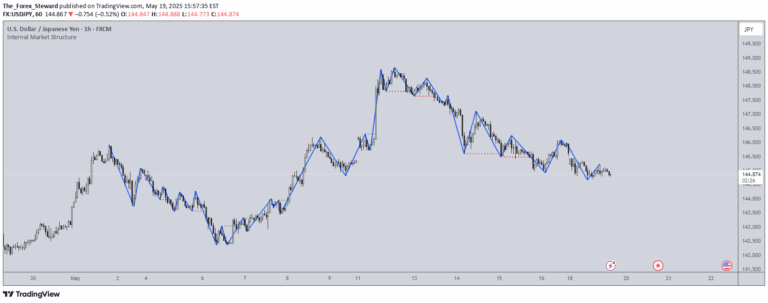
A market structure indicator that tracks price zigzags, identifying trend changes and market structure breaks with color-coded visualization and adjustable parameters.
Explore complementary indicator rolesHow it works
The indicator creates a market structure by drawing zigzag lines between price highs and lows, automatically tracking market movements with a slight delay. It uses a 'length' parameter to adjust the frequency of signal generation, allowing traders to customize the sensitivity of trend detection. The zigzag lines are color-coded, with green representing upward movements and red indicating downward trends.
By continuously plotting these lines, the indicator helps visualize market structure and potential trend changes. When the current price breaks through an established market structure, the indicator signals this event, providing traders with real-time insights into potential trend reversals or momentum shifts.
Why it may be useful
Market structure indicators are crucial for understanding price dynamics and identifying potential trend changes in trading. By visually representing price movements through zigzag lines, traders can quickly interpret market conditions and make more informed decisions about entry and exit points. The color-coded visualization makes it easy to distinguish between bullish and bearish trends at a glance.
The ability to adjust the indicator's length allows traders to adapt to different market conditions and trading styles. By providing a clear representation of market structure and signaling potential breakouts, this indicator helps traders recognize important price action patterns and potential trading opportunities across various timeframes.
When to explore it
This market structure indicator is most effective in markets with clear trending behavior, such as forex, stocks, and cryptocurrencies. It works best in timeframes ranging from short-term scalping to longer-term swing trading, making it versatile for different trading strategies. Traders should pay special attention to the color changes and structure breaks as potential signal points.
The indicator is particularly useful during periods of market volatility when trend identification becomes challenging. By providing a visual representation of price movements and highlighting potential trend reversals, it can help traders make more confident trading decisions. Combining this indicator with other technical analysis tools can further enhance its effectiveness in identifying high-probability trading opportunities.
Keep exploring
What we’ve verified
Access, alerts and repainting behaviour have not been independently verified for this indicator. Check the creator’s current publication and settings.
General descriptions and classifications are recovered research. Verified details above identify the specific checks we have completed. Check the creator’s current publication for later changes.