Smart QQE Mod
Smart QQE combines QQE trend analysis with RSI to provide trend direction and eliminate false signals through crossover and channel-based insights.
Explore 11,183 indicators. Filter beyond the obvious.
Discover the tools that fit the way you trade.
11,183 tools to explore
Smart QQE combines QQE trend analysis with RSI to provide trend direction and eliminate false signals through crossover and channel-based insights.
ADX Trend Filter Indicator combines EMA trend and ADX/DMI to provide visual insights into market trend direction, strength, and potential buy/sell crossover signals.
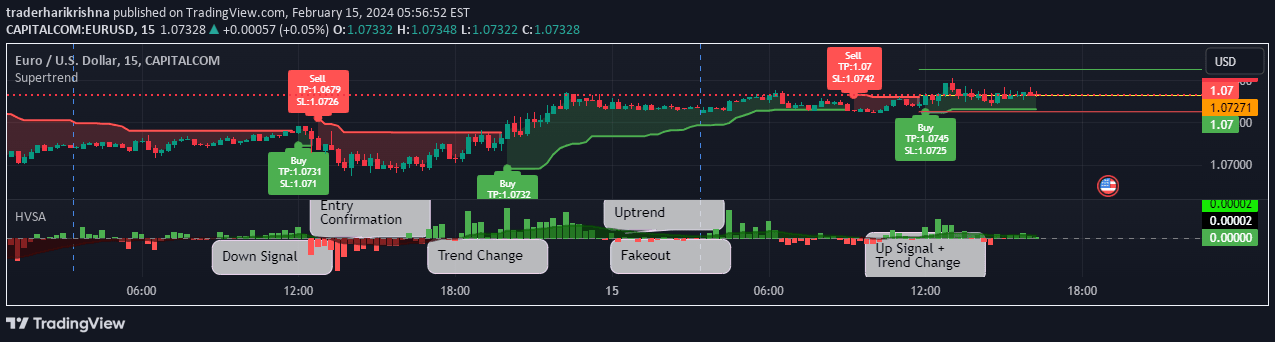
A Volume Spread Analysis indicator that identifies trend direction and volume breakouts by analyzing price, volume changes, and histogram crossovers for potential trading signals.
Parabolic Support Resistance (PSAR SR) identifies dynamic reversal points in price, plotting support and resistance levels to help traders confirm potential trend changes and entry points.
SAR MACD is a hybrid trading indicator combining MACD and Parabolic SAR to detect trend direction, eliminate fake signals, and confirm market movements with color-coded visual indicators.
A multi-timeframe SSL Channel indicator that identifies trend direction, support/resistance levels, and potential breakouts by using high and low simple moving averages.
RSI Trend Filter that visualizes trend direction and conditions by scaling RSI on the chart, revealing hidden divergence and providing clear oversold/overbought signals.
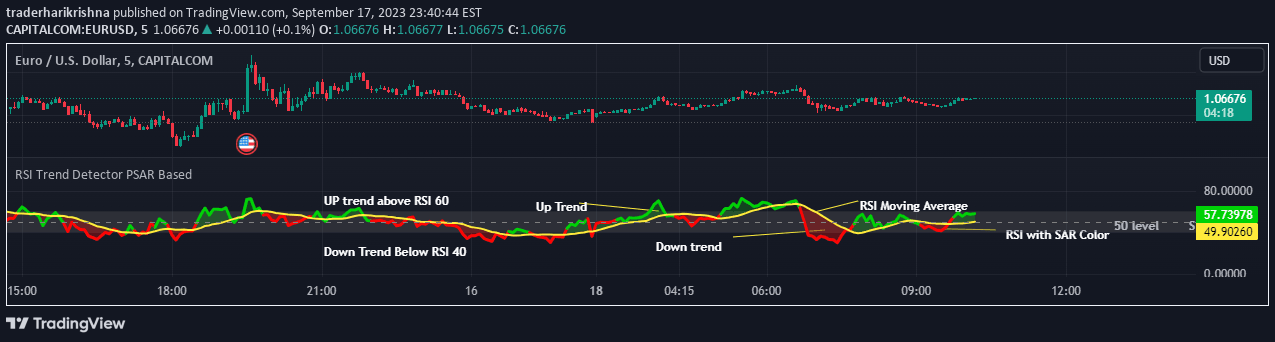
RSI Trend Detector combines RSI with PSAR to identify market trend direction, providing clear signals for entry points and trend strength using color-coded indicators.
RDX combines RSI and ADX to provide relative price direction, trend strength, and market momentum through a unique visual indicator that adapts to market conditions.
RiverFlow ADX Screener combines Donchian Channels and ADX to identify trend direction and strength across multiple timeframes, providing strategic entry and exit signals.
HTF Candles plot previous daily candles with current price update, displaying OHLC values that serve as dynamic support and resistance levels across different timeframes.
Candle Stick Heatmap analyzes hourly candlestick patterns across different timeframes, revealing recurring market behavior and potential trading opportunities using multiple technical indicators.
Likes, views, and comments are historical TradingView snapshots. They describe attention, not trading performance.