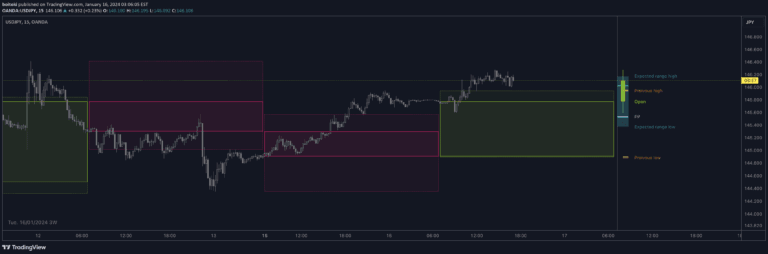
HTF Candles plot previous daily candles with current price update, displaying OHLC values that serve as dynamic support and resistance levels across different timeframes.
Explore complementary indicator rolesHow it works
The HTF Candles signal works by plotting three previous daily candles alongside the current timeframe's price action. It captures the Open, High, Low, and Close (OHLC) values from higher and lower timeframes, creating a comprehensive view of price movement and potential key levels. The indicator integrates multiple timeframe perspectives, allowing traders to see how current price relates to recent historical price structures.
Each candle represents a specific time period, with the last HTF candle incorporating four previous lower timeframe candles. This multi-layered approach provides traders with a nuanced understanding of price dynamics, revealing potential support and resistance zones that might not be immediately visible on a single timeframe chart.
Why it may be useful
The HTF Candles signal is crucial for traders seeking a holistic view of market movements across different timeframes. By displaying OHLC values from multiple perspectives, it helps traders identify key price levels, potential trend reversals, and support/resistance zones with greater precision. This comprehensive approach enables more informed decision-making by connecting short-term price action with broader market context.
Traders can leverage these insights to improve entry and exit strategies, understand market structure more deeply, and develop a more nuanced interpretation of price movements. The signal's ability to integrate different timeframe perspectives provides a strategic advantage in analyzing market dynamics and potential trading opportunities.
When to explore it
The HTF Candles signal is most effective during periods of trending markets and when seeking to understand broader market context beyond the current timeframe. Traders can utilize this tool when analyzing potential trade setups, looking to confirm trend strength, or identifying key support and resistance levels across different time perspectives.
It is particularly useful for traders who want to align their trades with larger market structures. The signal works best when combined with other technical analysis tools and when traders are looking to make more informed decisions based on a multi-timeframe approach. It is especially valuable during volatile market conditions, helping traders gain a more comprehensive understanding of price movements and potential trading opportunities.
Keep exploring
What we’ve verified
Access, alerts and repainting behaviour have not been independently verified for this indicator. Check the creator’s current publication and settings.
General descriptions and classifications are recovered research. Verified details above identify the specific checks we have completed. Check the creator’s current publication for later changes.