Liquidity Heatmap LTF [LuxAlgo]
A trading tool that visualizes candle bodies with the highest volume on a lower timeframe, highlighting areas of significant market activity using color-coded heatmaps and interval lines.
Explore 11,183 indicators. Filter beyond the obvious.
Discover the tools that fit the way you trade.
11,183 tools to explore
A trading tool that visualizes candle bodies with the highest volume on a lower timeframe, highlighting areas of significant market activity using color-coded heatmaps and interval lines.
A volume-based trading signal that identifies potential entries by analyzing price and volume divergences and creates dynamic trailing stop lines for trade management.
Volume Zones Internal Visualizer is an advanced candle type that reveals lower timeframe volume activity on a higher timeframe chart, highlighting volume zones and peak activity levels.
A comprehensive trading indicator that combines multiple market analysis techniques including liquidity sweeps, fair value gaps, market structure shifts, and trading sessions for precise market entry and exit points.
A dynamic multi-timeframe chart visualization tool that displays five lower timeframe candle charts simultaneously, offering flexible charting options like Heikin-Ashi and baseline views.
LTF Candle Insights offers a dual-view trading indicator that overlays lower timeframe candles onto the current chart, enabling detailed market trend and price level analysis.
An advanced volume analysis tool that visualizes supply and demand dynamics by tracking buyer and seller strength within candlesticks, helping traders understand market momentum and potential trend reversals.
A multi-timeframe MACD indicator that provides real-time trend analysis across different timeframes without manually switching charts, enabling more comprehensive trend confirmation.
A volume analysis tool comparing tick and lower time frame data to measure price and volume movements, revealing volume delta and cumulative volume delta in trading.
A sophisticated trading tool that identifies institutional liquidity levels and key market dynamics across multiple timeframes, helping traders make informed trading decisions.
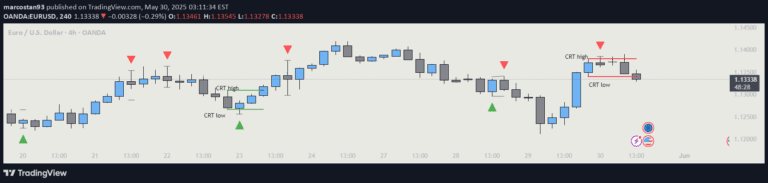
A trading indicator that identifies potential market reversals or continuations by analyzing two consecutive candle patterns and generating visual signals with triangular markers.
A trading indicator that identifies potential market manipulation points by tracking lower timeframe pivot highs and lows to reveal institutional trading strategies.
Likes, views, and comments are historical TradingView snapshots. They describe attention, not trading performance.