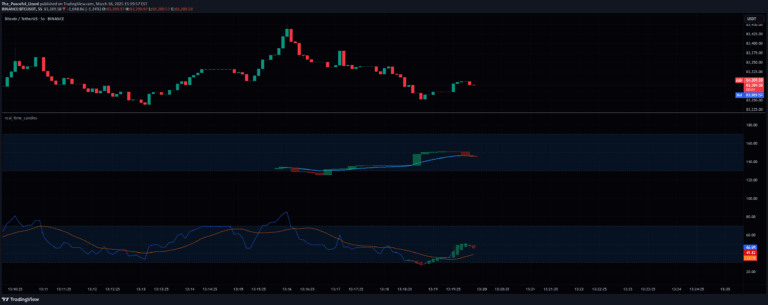
A dynamic multi-timeframe chart visualization tool that displays five lower timeframe candle charts simultaneously, offering flexible charting options like Heikin-Ashi and baseline views.
Explore complementary indicator rolesHow it works
The Sync Frame indicator automatically calculates and generates five lower timeframe charts based on the current chart's timeframe. It dynamically scales these charts to fit the user's screen, adjusting both height and width.
Users can choose between traditional candlestick, baseline, and Heikin-Ashi chart types. The indicator uses the from_seconds() function to compute timeframes, ensuring precise and flexible chart representations. Each lower timeframe chart provides a comprehensive view of price action at different scales
Why it may be useful
Multi-timeframe analysis is crucial for traders seeking a comprehensive market perspective. By displaying five simultaneous lower timeframe charts, traders can identify subtle price movements and potential trend changes that might be missed on a single chart.
The flexible visualization helps traders understand market dynamics across different time scales, improving decision-making and market interpretation. The ability to switch between chart types adds versatility, allowing traders to analyze price action from multiple analytical angles
When to explore it
This indicator is most effective during volatile market conditions or when trading assets with complex price movements. Traders can utilize it during trend identification, market entry and exit point selection, and when performing detailed technical analysis.
It's particularly useful for day traders and swing traders who need to quickly assess market trends across multiple timeframes. The tool is beneficial in markets like forex, stocks, and cryptocurrencies where rapid price changes and nuanced trend analysis are critical
Keep exploring
What we’ve verified
Access, alerts and repainting behaviour have not been independently verified for this indicator. Check the creator’s current publication and settings.
General descriptions and classifications are recovered research. Verified details above identify the specific checks we have completed. Check the creator’s current publication for later changes.