Volume Analysis - Heatmap and Volume Profile
Advanced volume analysis tool that creates a heatmap and volume profile, providing detailed insights into trading volume, price movements, and market structure across different time frames.
Explore 11,183 indicators. Filter beyond the obvious.
Discover the tools that fit the way you trade.
11,183 tools to explore
Advanced volume analysis tool that creates a heatmap and volume profile, providing detailed insights into trading volume, price movements, and market structure across different time frames.
A dynamic multi-timeframe chart visualization tool that displays five lower timeframe candle charts simultaneously, offering flexible charting options like Heikin-Ashi and baseline views.
LTF Candle Insights offers a dual-view trading indicator that overlays lower timeframe candles onto the current chart, enabling detailed market trend and price level analysis.
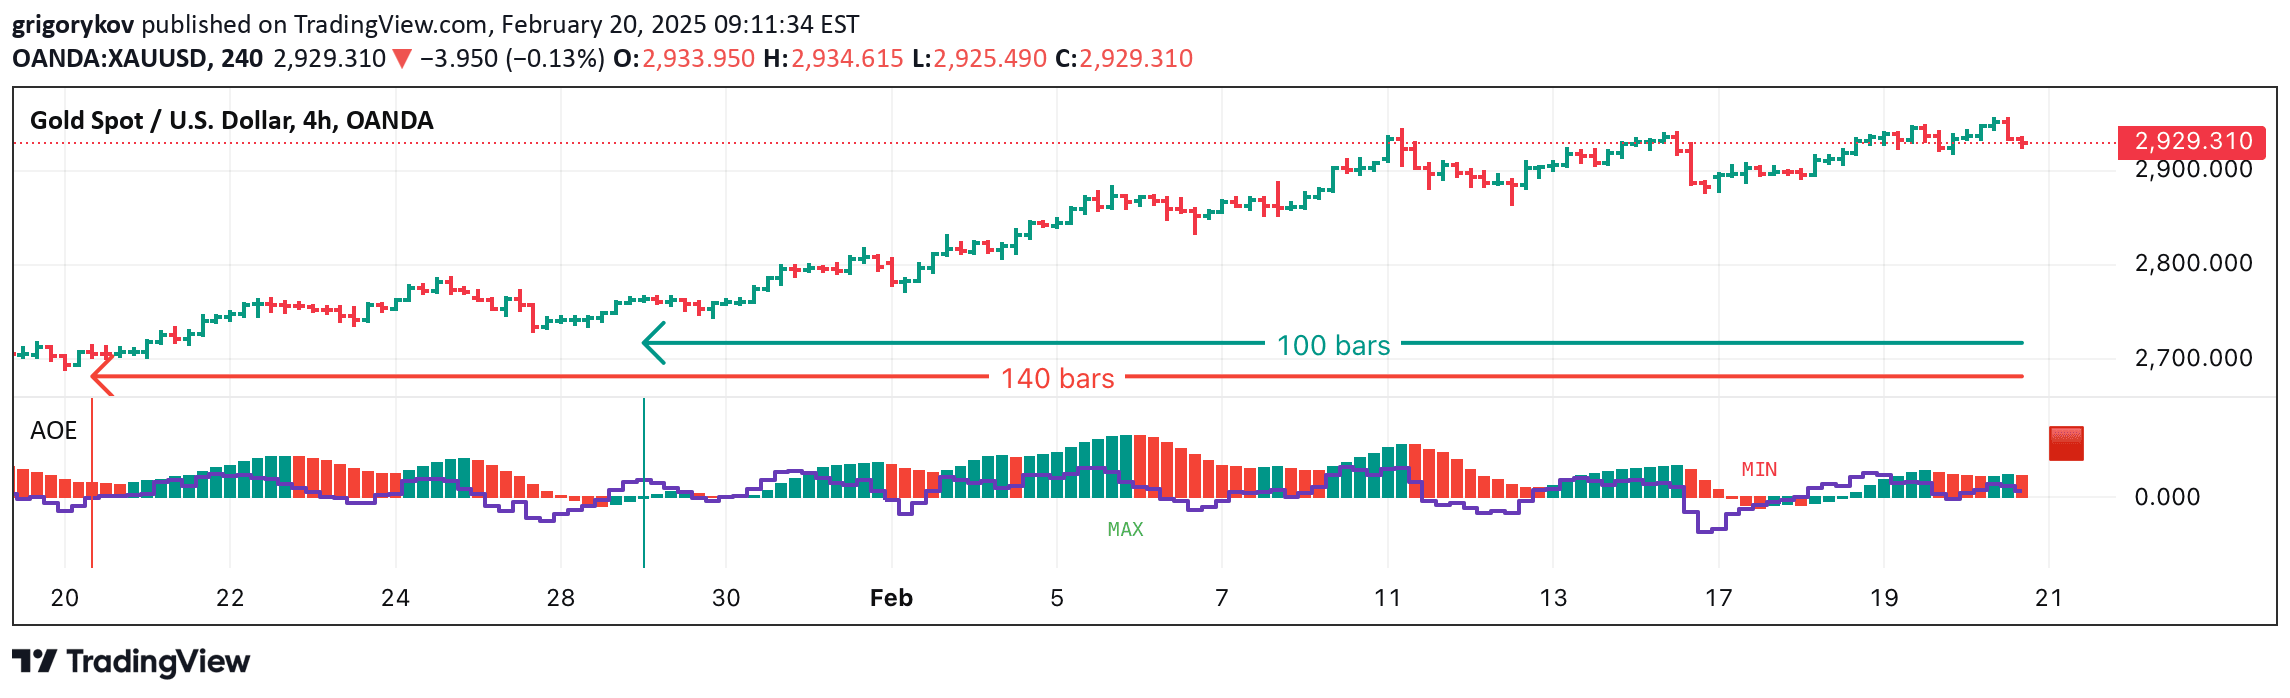
An advanced trading indicator combining Awesome Oscillator and EMA lines to identify Elliott wave patterns and price momentum using customizable moving average calculations.
An auto-magnifier tool that zooms into main timeframe candles, revealing lower timeframe price action and volume details with customizable visualization.
A trading session template indicator that allows customization of trading hours, highlights specific market sessions, and provides candle pattern detection with advanced filtering options.
A trading tool for analyzing price action by plotting multiple lower timeframe candles within larger candles, revealing hidden market movements and potential reversals.
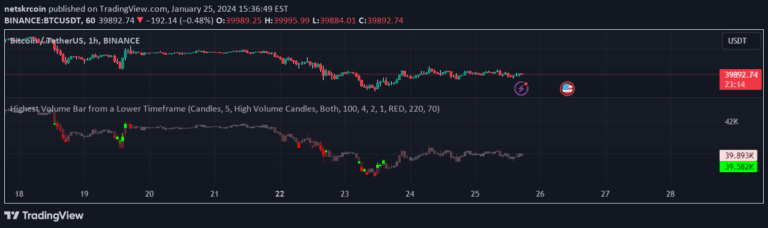
A volume-based indicator that identifies high-volume candles across different timeframes, helping traders analyze trading activity and potential market movements.
A multi-timeframe volume analysis tool that normalizes and smooths volume data across different periods, providing insights into market dynamics and momentum shifts.
A volume analysis tool that tracks gross volume, net lower time frame volume, and cumulative daily session volume to evaluate market participation and momentum.
A trading indicator that retrieves and visualizes candle data from lower timeframes, allowing traders to analyze multiple chart perspectives simultaneously.
A specialized script that highlights price at a specific sub-bar time, enabling precise entry and exit point identification for trading strategies that depend on timing.
Likes, views, and comments are historical TradingView snapshots. They describe attention, not trading performance.