
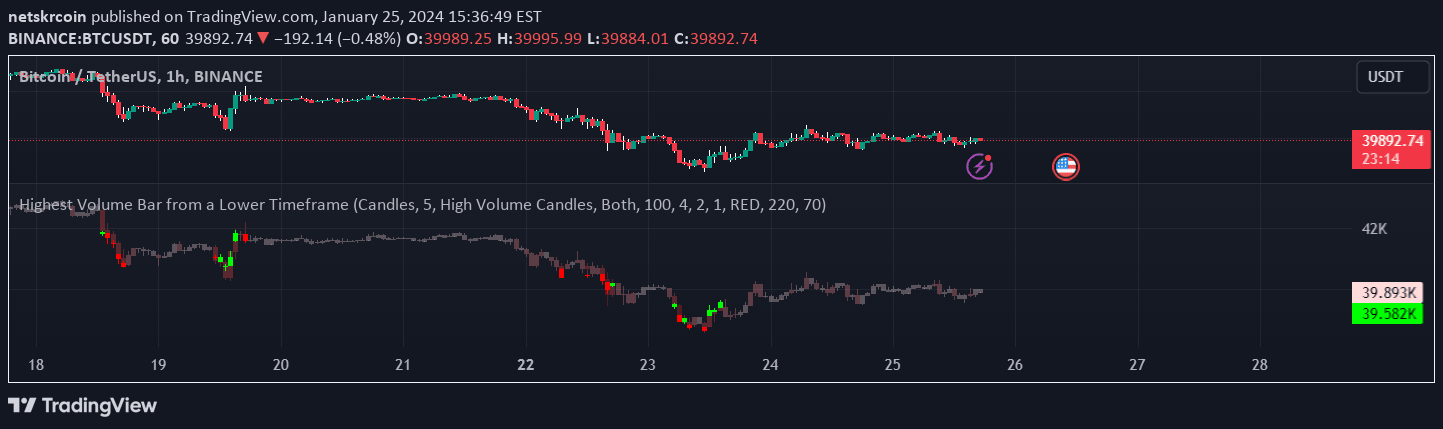
A volume-based indicator that identifies high-volume candles across different timeframes, helping traders analyze trading activity and potential market movements.
Explore complementary indicator rolesHow it works
The volume indicator analyzes trading volume across multiple timeframes to identify significant market activity. It calculates volume levels using a Simple Moving Average (SMA) and classifies candles as high, medium, or low volume based on predefined multipliers.
The indicator offers two display modes: Candles and Volume. In Candles mode, it shows the current timeframe's candlesticks alongside the highest volume candle from a lower timeframe. In Volume mode, it presents a histogram of the current timeframe's volume and highlights the highest volume bar from the lower timeframe.
Why it may be useful
Volume is a critical technical analysis tool that provides insights into the strength and momentum of price movements. By identifying high-volume candles, traders can confirm trend reversals, validate breakouts, and gauge market sentiment more effectively.
The multi-timeframe approach allows traders to understand volume dynamics across different trading periods. This comprehensive view helps in making more informed trading decisions by revealing potential market turning points and confirming the significance of price movements.
When to explore it
The volume indicator is most effective during periods of significant market activity, such as breakouts, trend reversals, and key support/resistance level tests. Traders can use it to validate price movements and identify potential entry or exit points based on volume confirmation.
It is particularly useful in volatile markets where volume can provide additional context to price action. Traders should combine this indicator with other technical analysis tools to create a more robust trading strategy and reduce false signals.
Keep exploring
What we’ve verified
Access, alerts and repainting behaviour have not been independently verified for this indicator. Check the creator’s current publication and settings.
General descriptions and classifications are recovered research. Verified details above identify the specific checks we have completed. Check the creator’s current publication for later changes.


