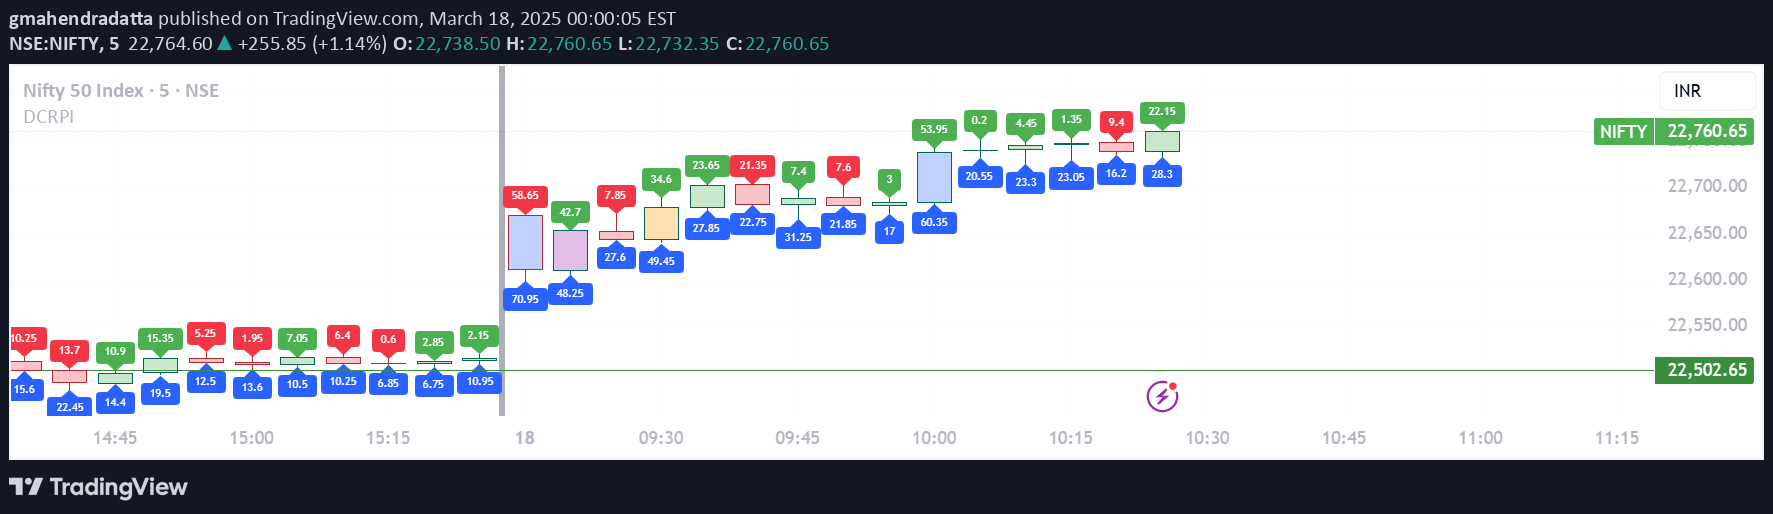
A visual indicator analyzing candle ranges, body movements, and volatility to help traders understand price action and potential market movements across different securities.
Explore complementary indicator rolesHow it works
The Modified Candle Range Volatility Gap Indicator examines the body and wicks of price candles to calculate range and volatility. It uses standard deviation calculations to provide context for price movements, allowing traders to understand the statistical significance of current price action.
The indicator plots both body range (open to close) and full candle range (high to low), creating visual overlays that help traders quickly assess price movement characteristics. By incorporating percentage options and gap analysis, the tool provides a comprehensive view of price behavior across different timeframes and securities.
Why it may be useful
This indicator helps traders understand price volatility and range dynamics in a more nuanced and visual manner. By displaying body and candle ranges with statistical context, traders can make more informed decisions about potential market movements and entry/exit points.
The tool's flexibility in analyzing different range types and incorporating standard deviation calculations allows traders to adapt the indicator to various trading styles and market conditions. Its visual representation makes complex statistical information more accessible and easier to interpret quickly.
When to explore it
The indicator works best in markets with clear price movements and when traders want to assess volatility across different timeframes. It is particularly useful for identifying potential reversal or continuation setups by providing statistical context to price ranges.
Traders can leverage this tool in trending and ranging markets to set stop losses, plan entries and exits, and understand the underlying price dynamics. Its versatility makes it valuable for scalpers, day traders, and swing traders seeking a comprehensive view of market volatility.
Keep exploring
What we’ve verified
Access, alerts and repainting behaviour have not been independently verified for this indicator. Check the creator’s current publication and settings.
General descriptions and classifications are recovered research. Verified details above identify the specific checks we have completed. Check the creator’s current publication for later changes.